sidebar.joinCommunitysidebar.communicateWithUsers
sidebar.joinAskTableCommunity

sidebar.wechat

sidebar.feishu
sidebar.chooseYourWayToJoin
sidebar.contactUssidebar.getProfessionalSupport

sidebar.aliyunOfferConsultationsidebar.scanForAliyunOffer

sidebar.wechat
sidebar.feishu
sidebar.chooseYourWayToJoin
Do you have these troubles:
The root cause of these problems: General AI doesn't understand your business, let alone have the professional analysis capabilities you need.
AskTable's solution: Transform professional data analyst capabilities into reusable skills and agents.
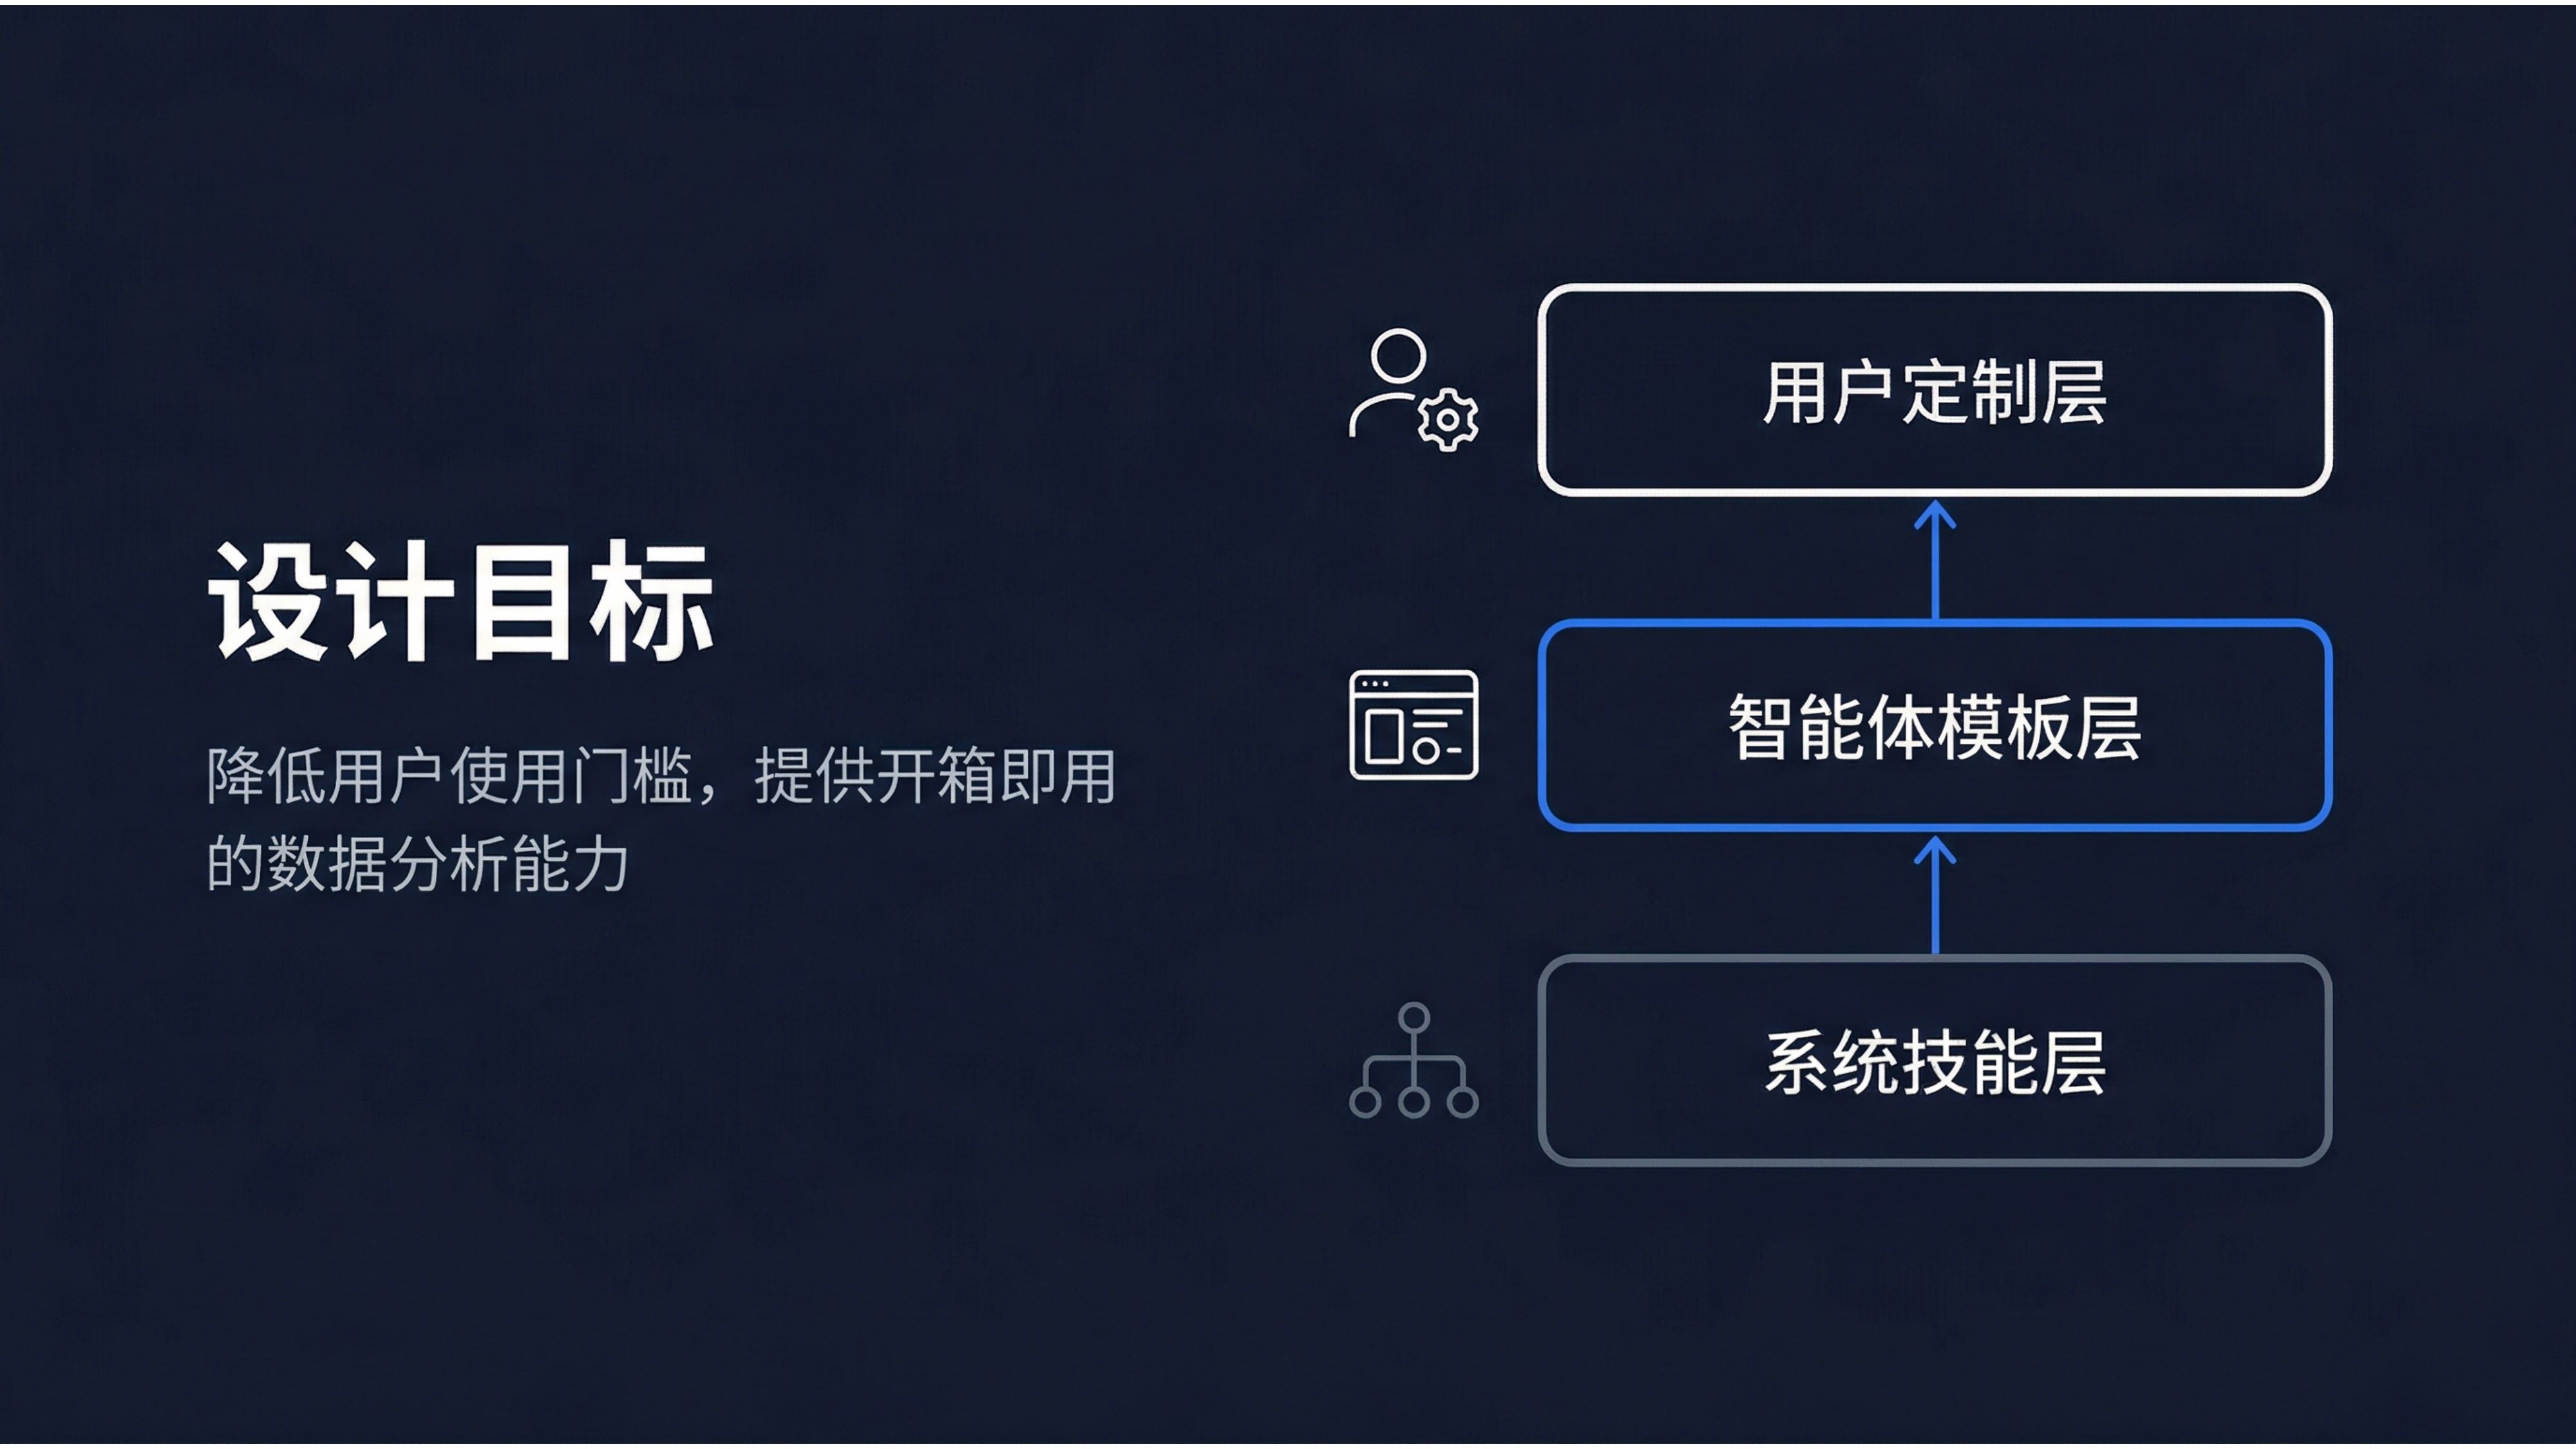
Skills are AskTable's built-in professional analysis capabilities, like an experienced analyst on standby. You don't need to tell it "how to analyze", just tell it "what to analyze".
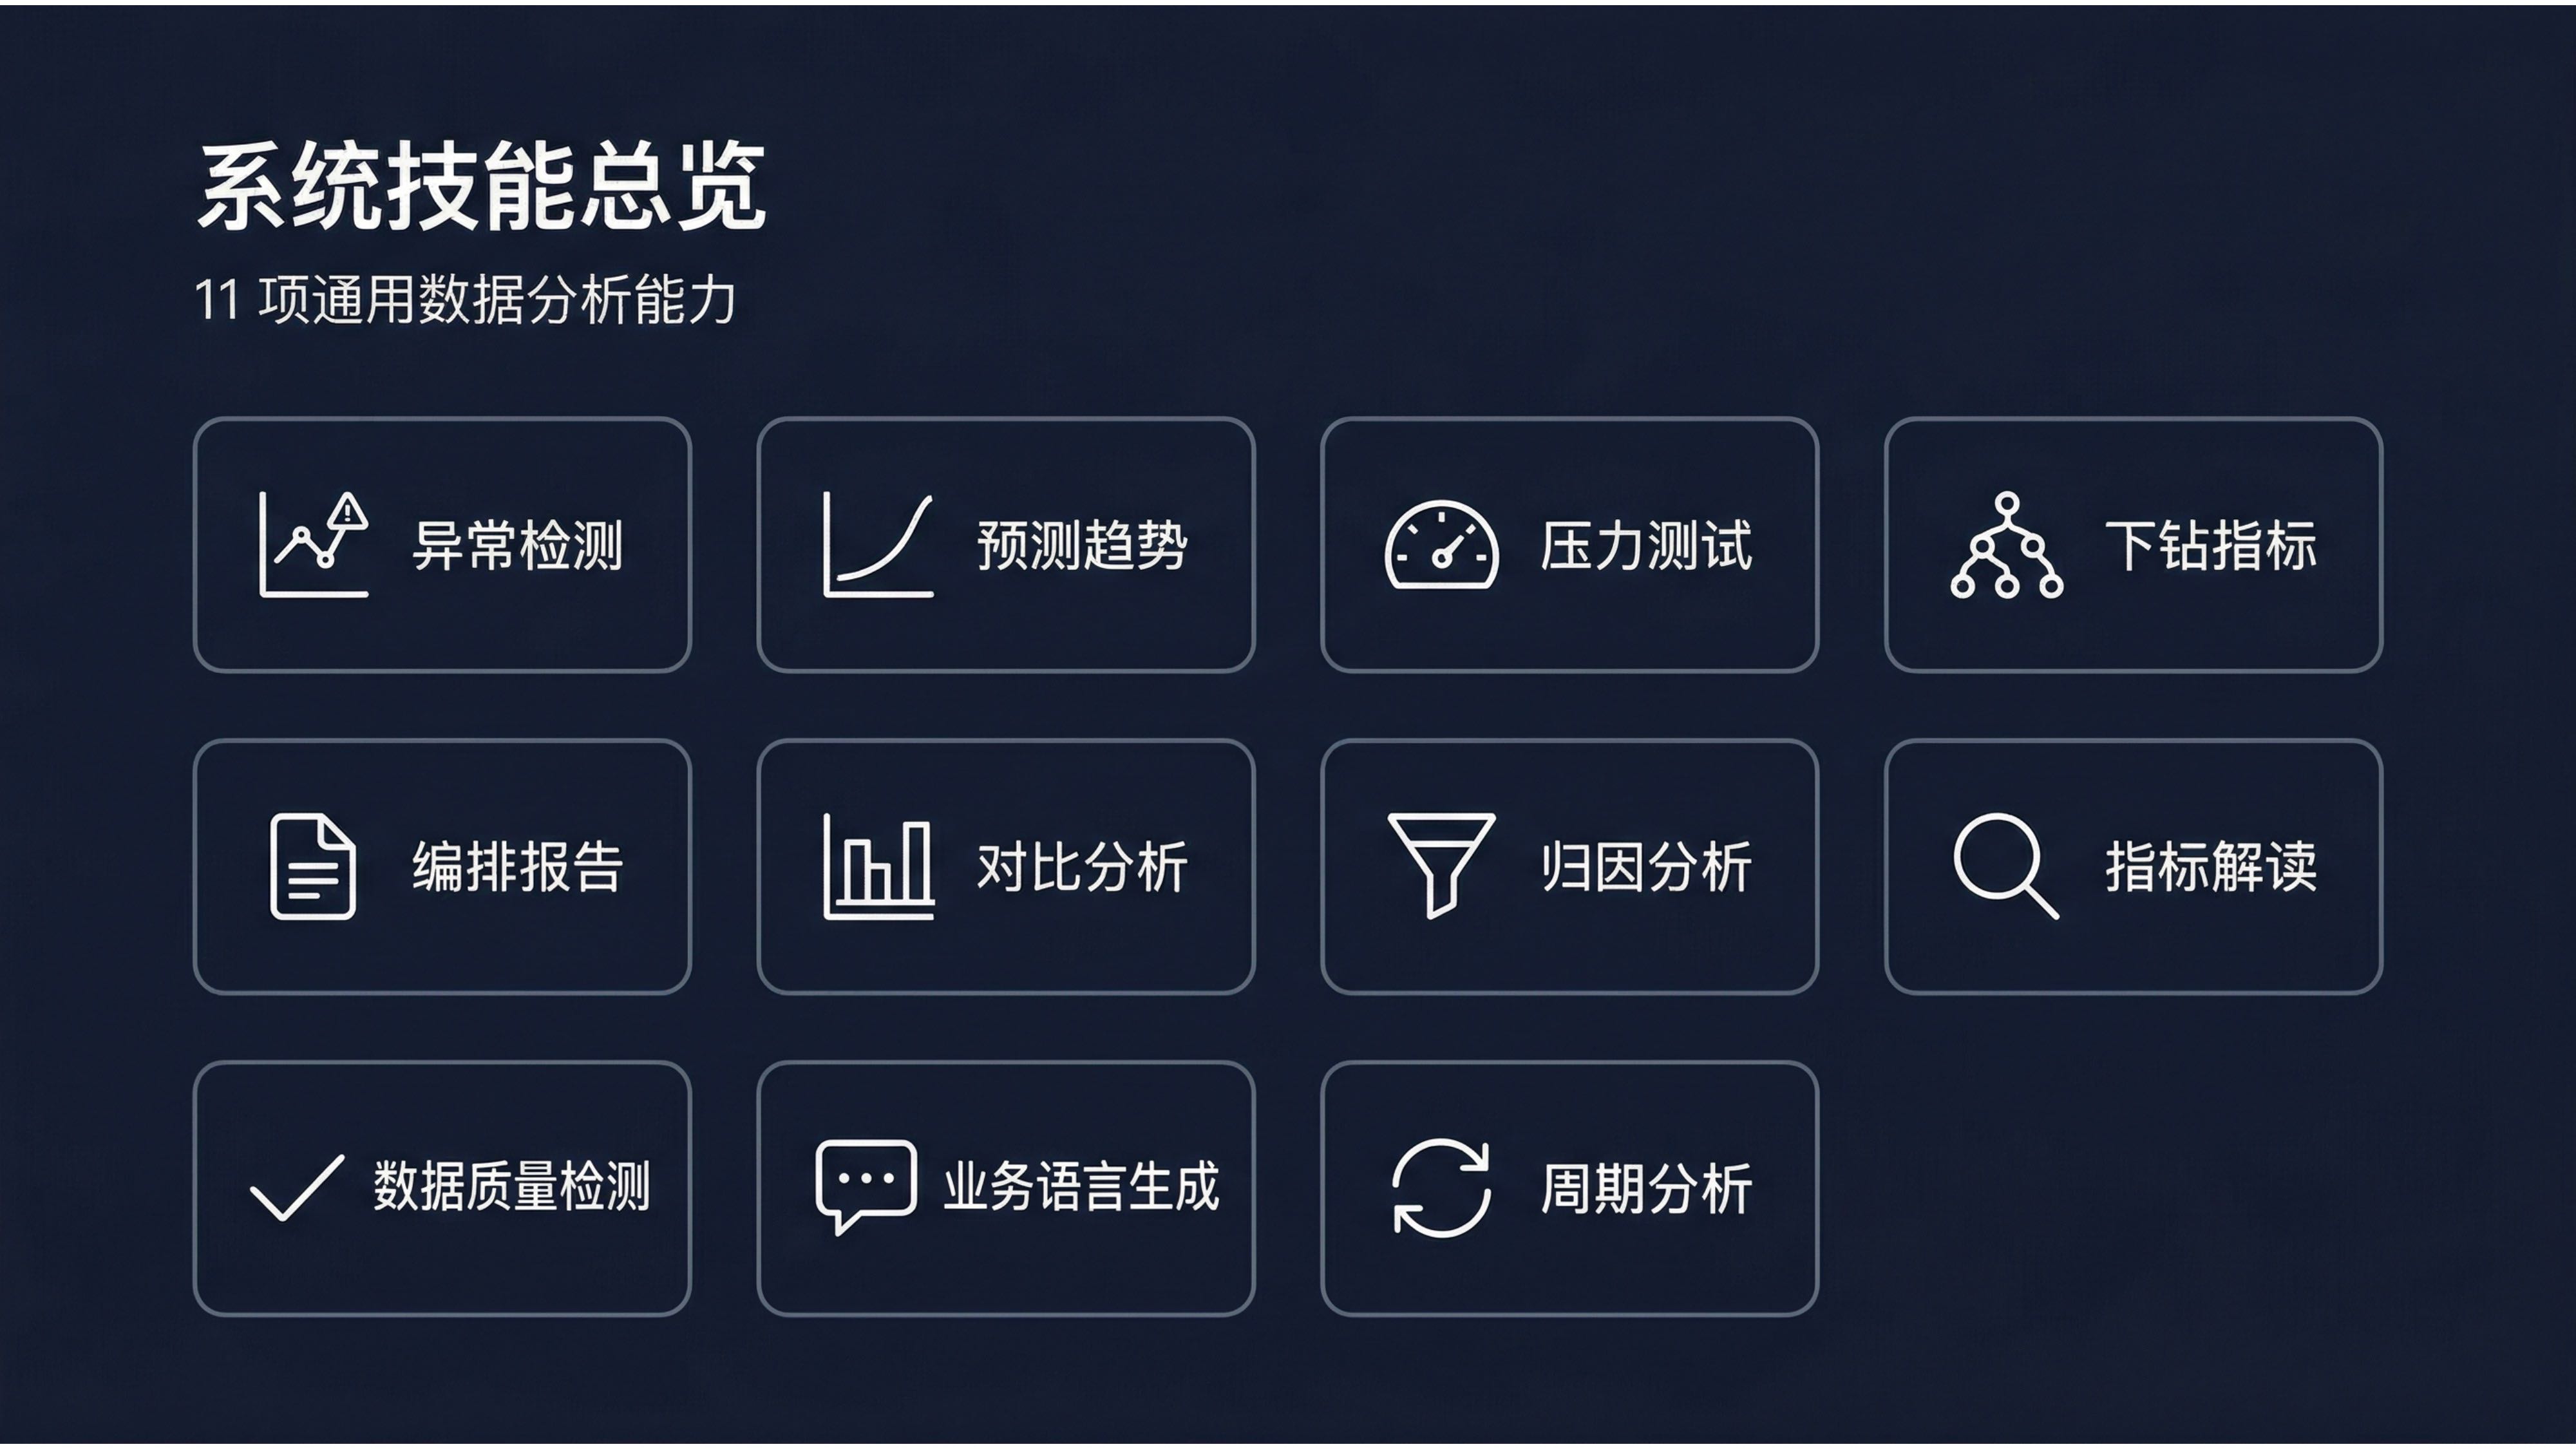
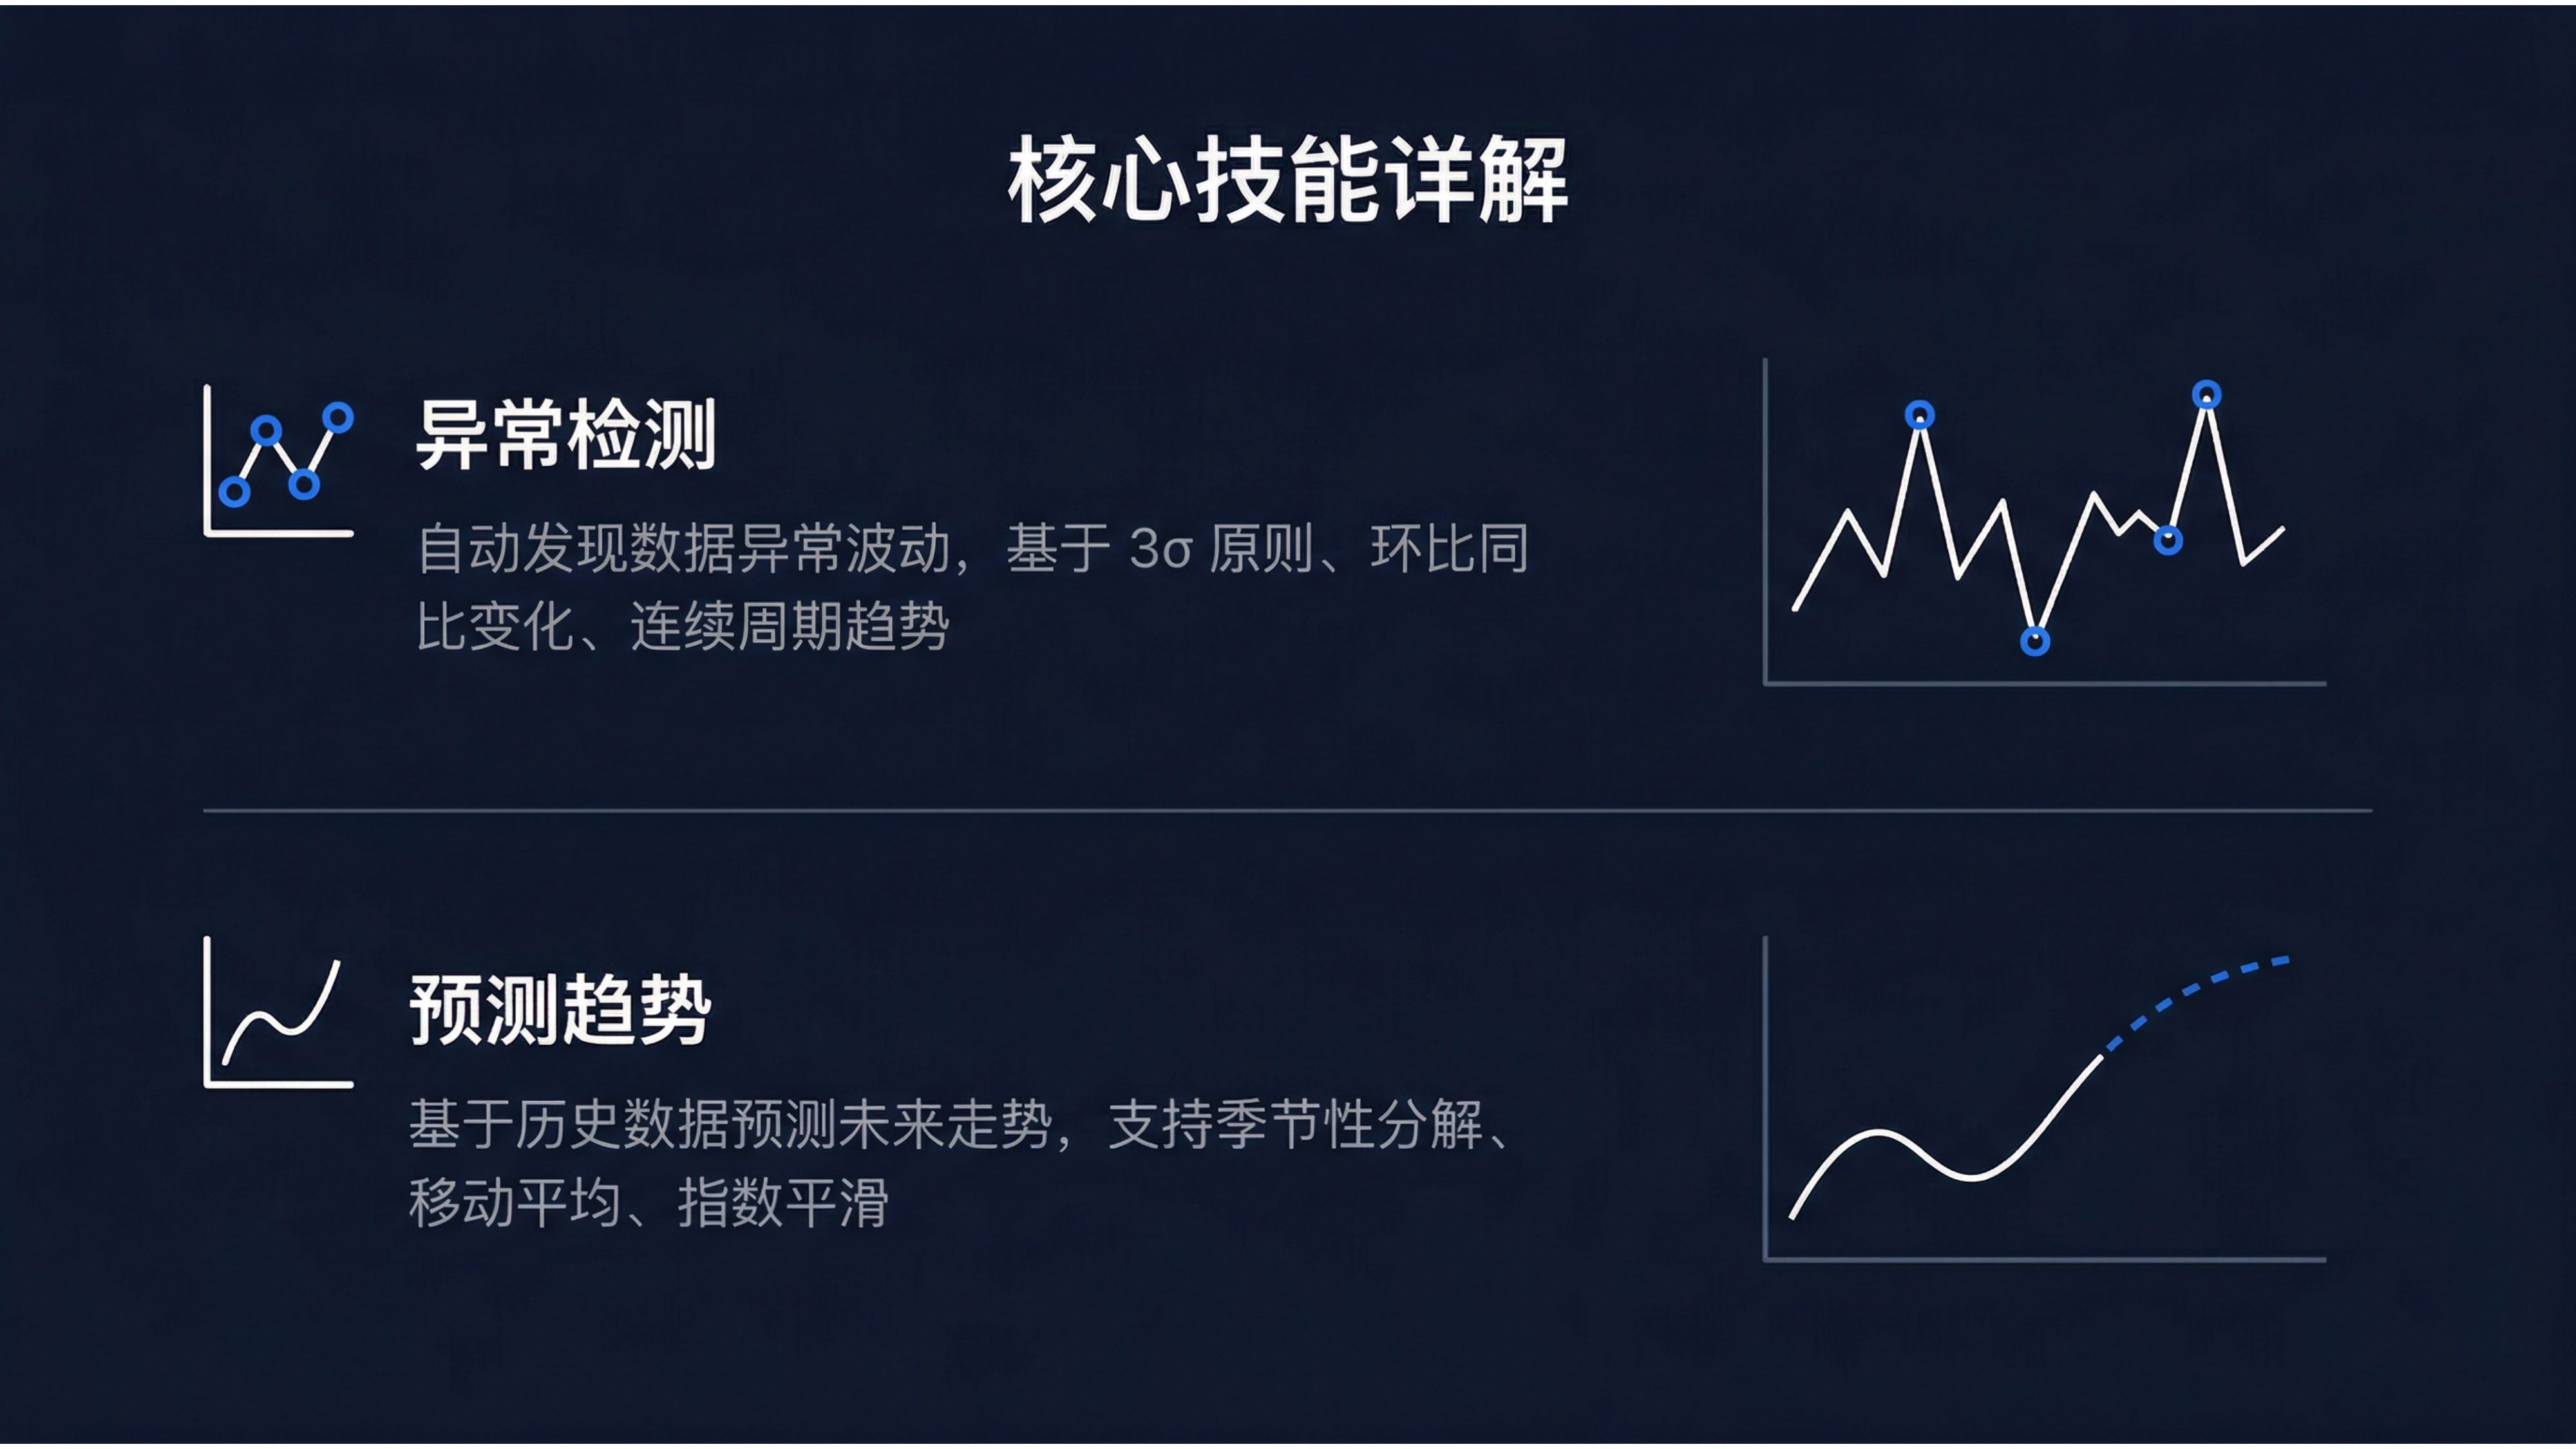
Automatically identify abnormal fluctuations in data, no longer relying on manual inspection.
Typical scenarios:
What it can do:
Predict trends based on historical data to assist planning decisions.
Typical scenarios:
What it can do:
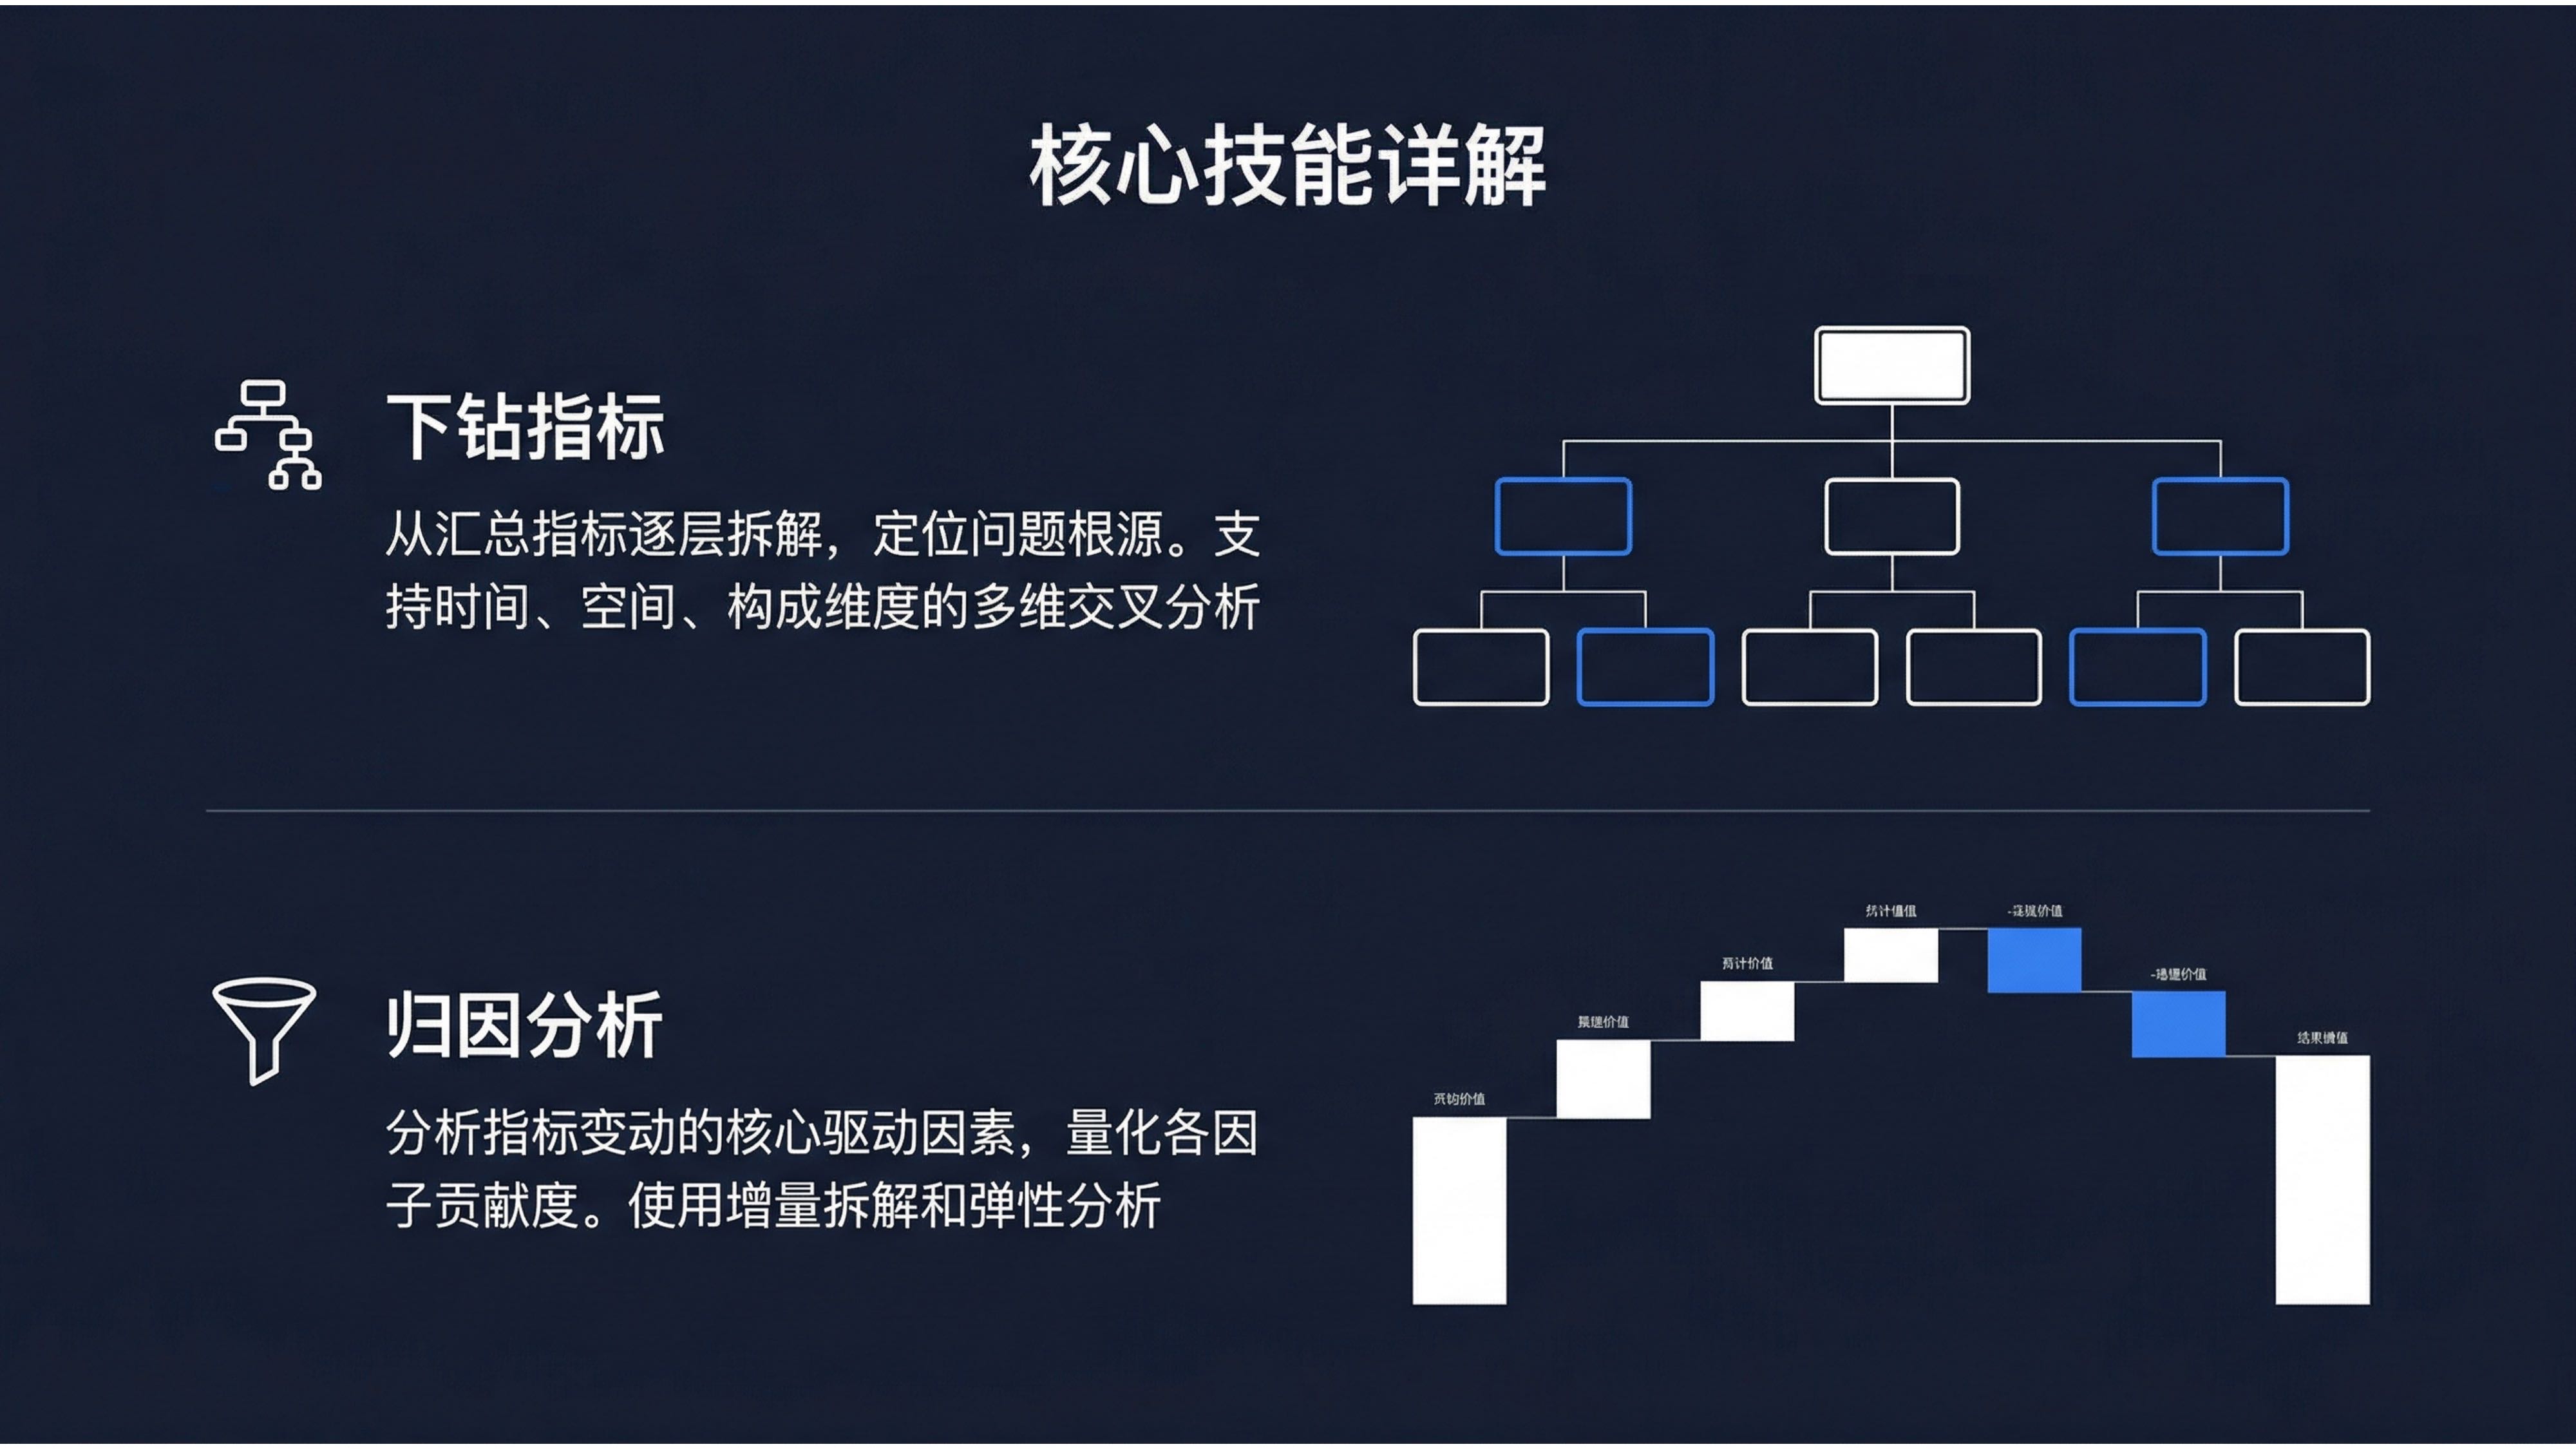
Decompose from summary metrics layer by layer to find specific causes of problems.
Typical scenarios:
What it can do:
Horizontal comparison to discover differences and opportunities.
Typical scenarios:
What it can do:
Analyze core drivers of metric changes and quantify each factor's contribution.
Typical scenarios:
What it can do:
Simulate different hypothetical scenarios to evaluate business performance under extreme conditions.
Typical scenarios:
What it can do:
Identify cycle patterns in data to understand the logic behind fluctuations.
Typical scenarios:
What it can do:
Organize data analysis results into structured reports.
Typical scenarios:
What it can do:
Translate technical metrics into language business people can understand.
Typical scenarios:
What it can do:
Proactively detect data quality to ensure analysis results are accurate.
Typical scenarios:
What it can do:
Transform data into warm business narratives.
Typical scenarios:
What it can do:
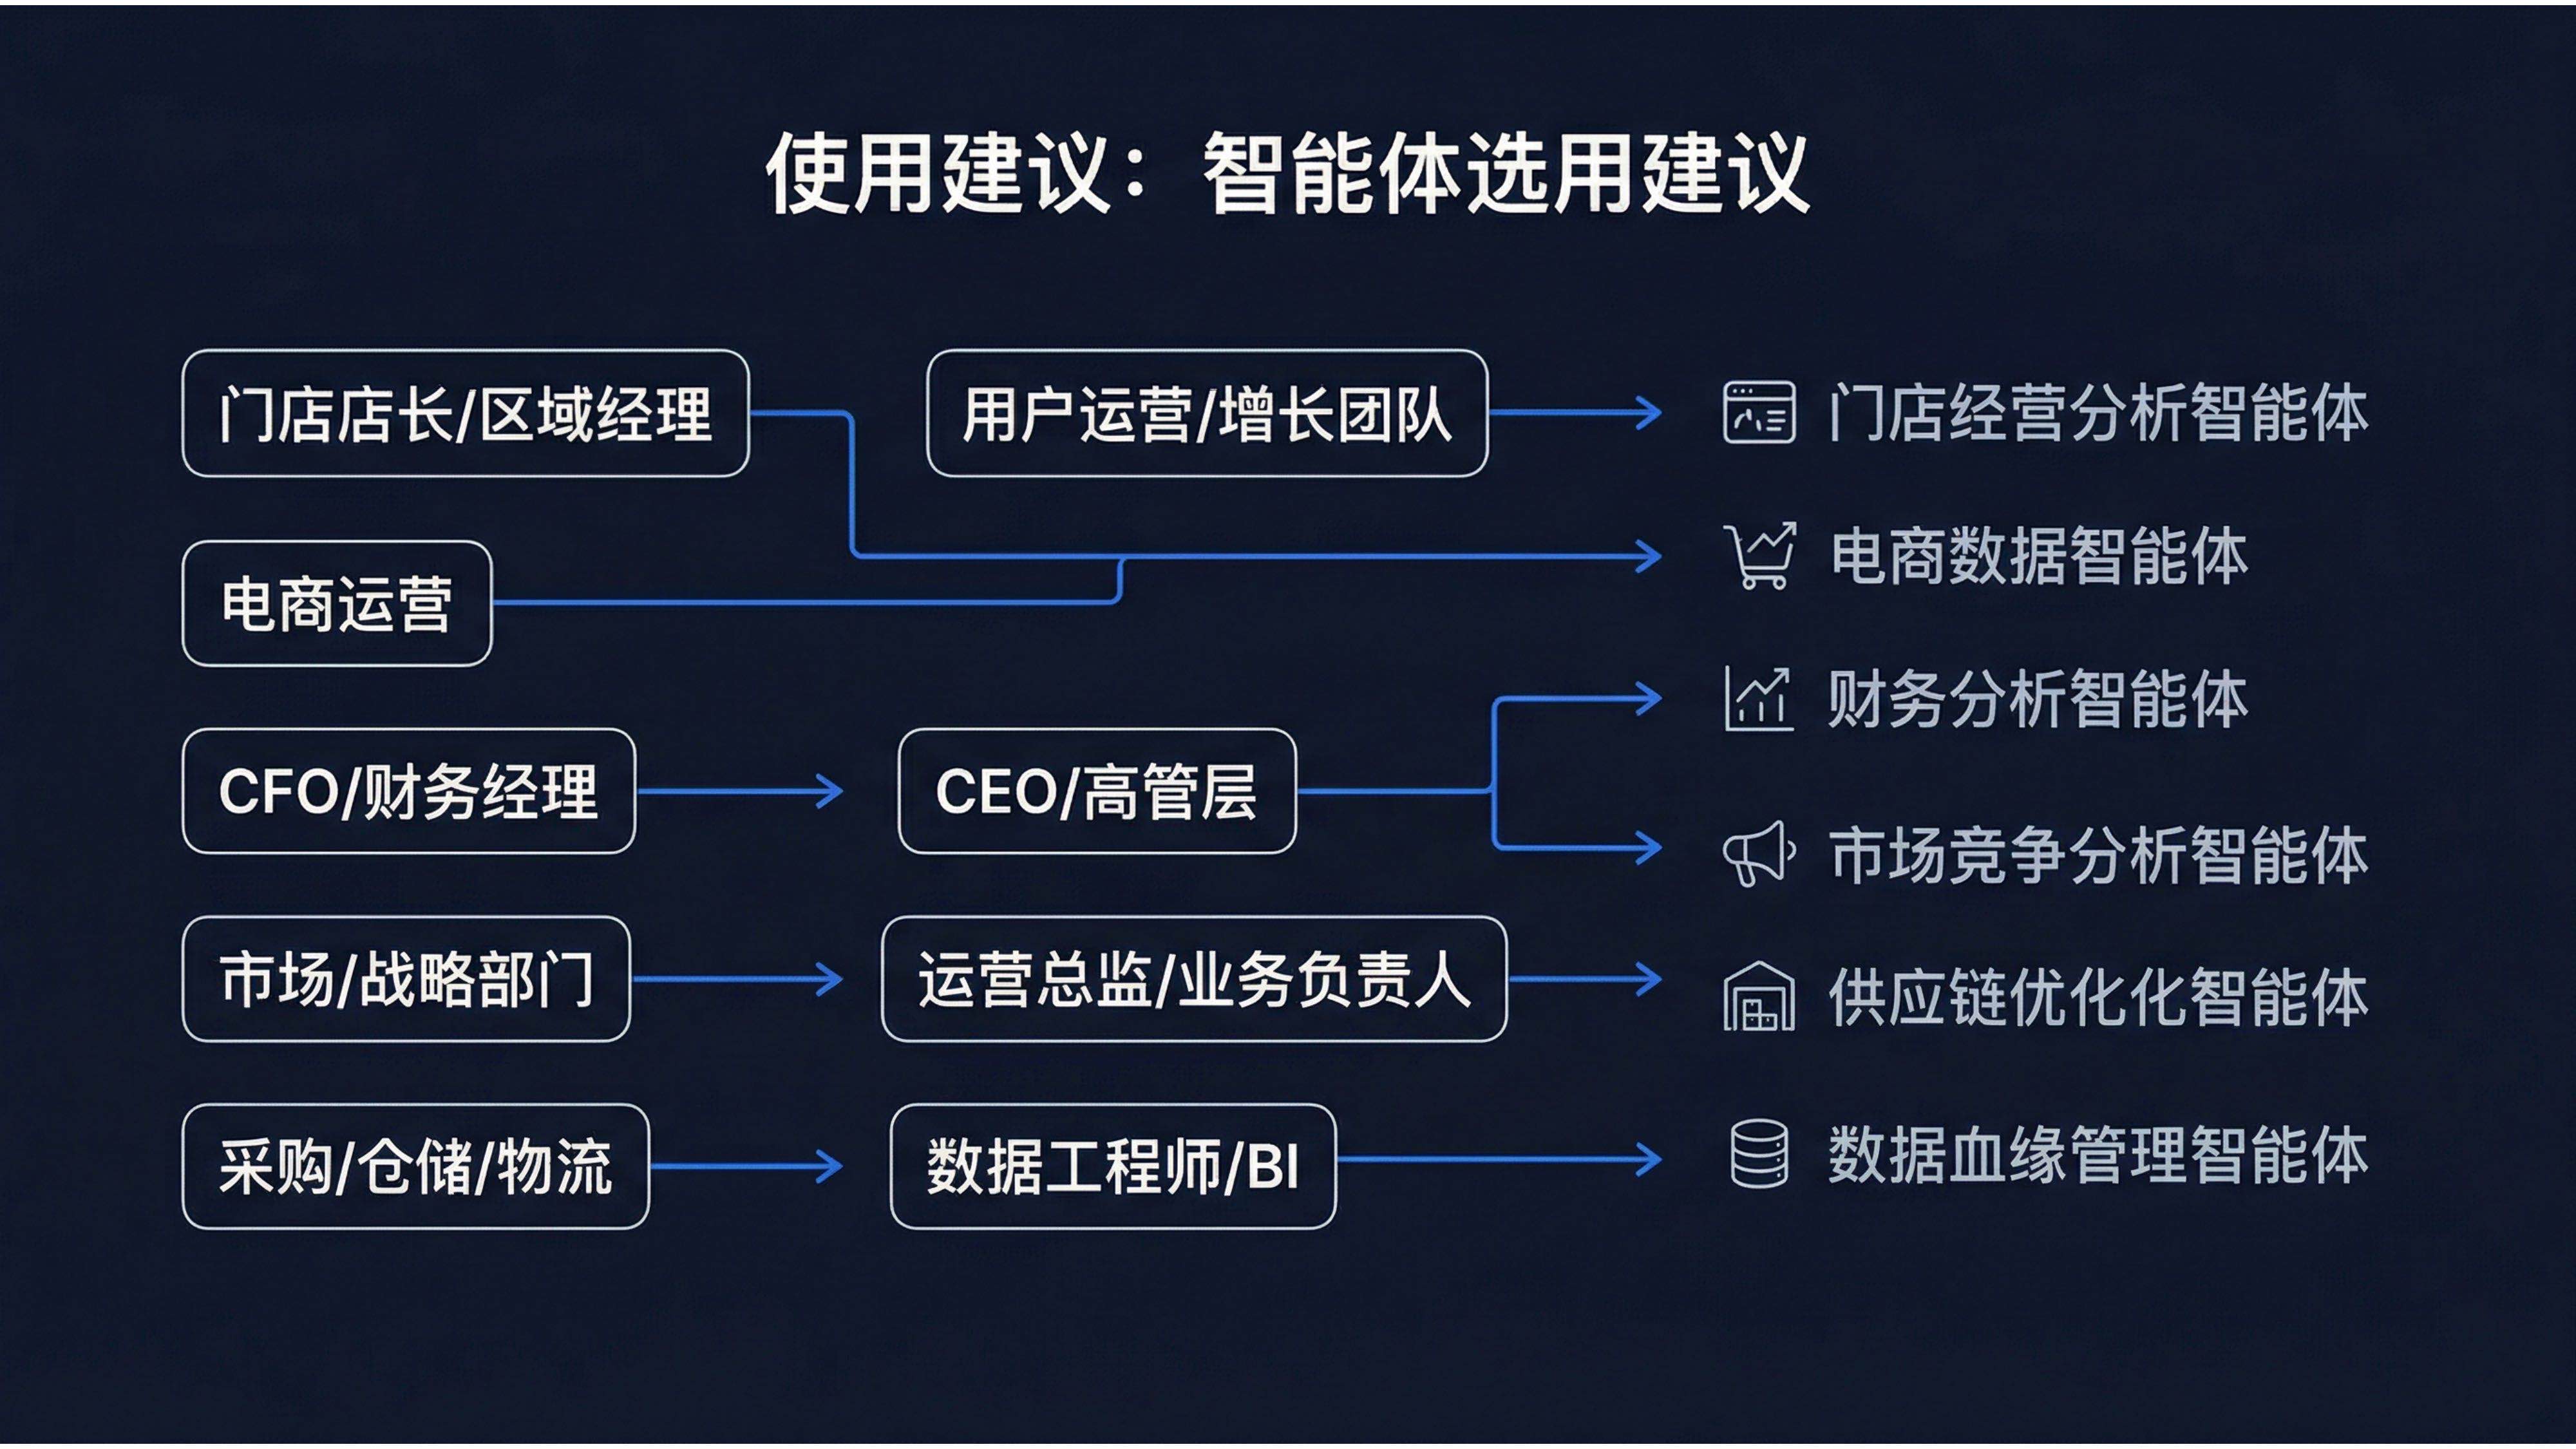
Agents are skill combinations plus role settings and business knowledge, forming a "knowledgeable" virtual colleague. You don't need to configure skills one by one, just select an appropriate agent and it can start working.
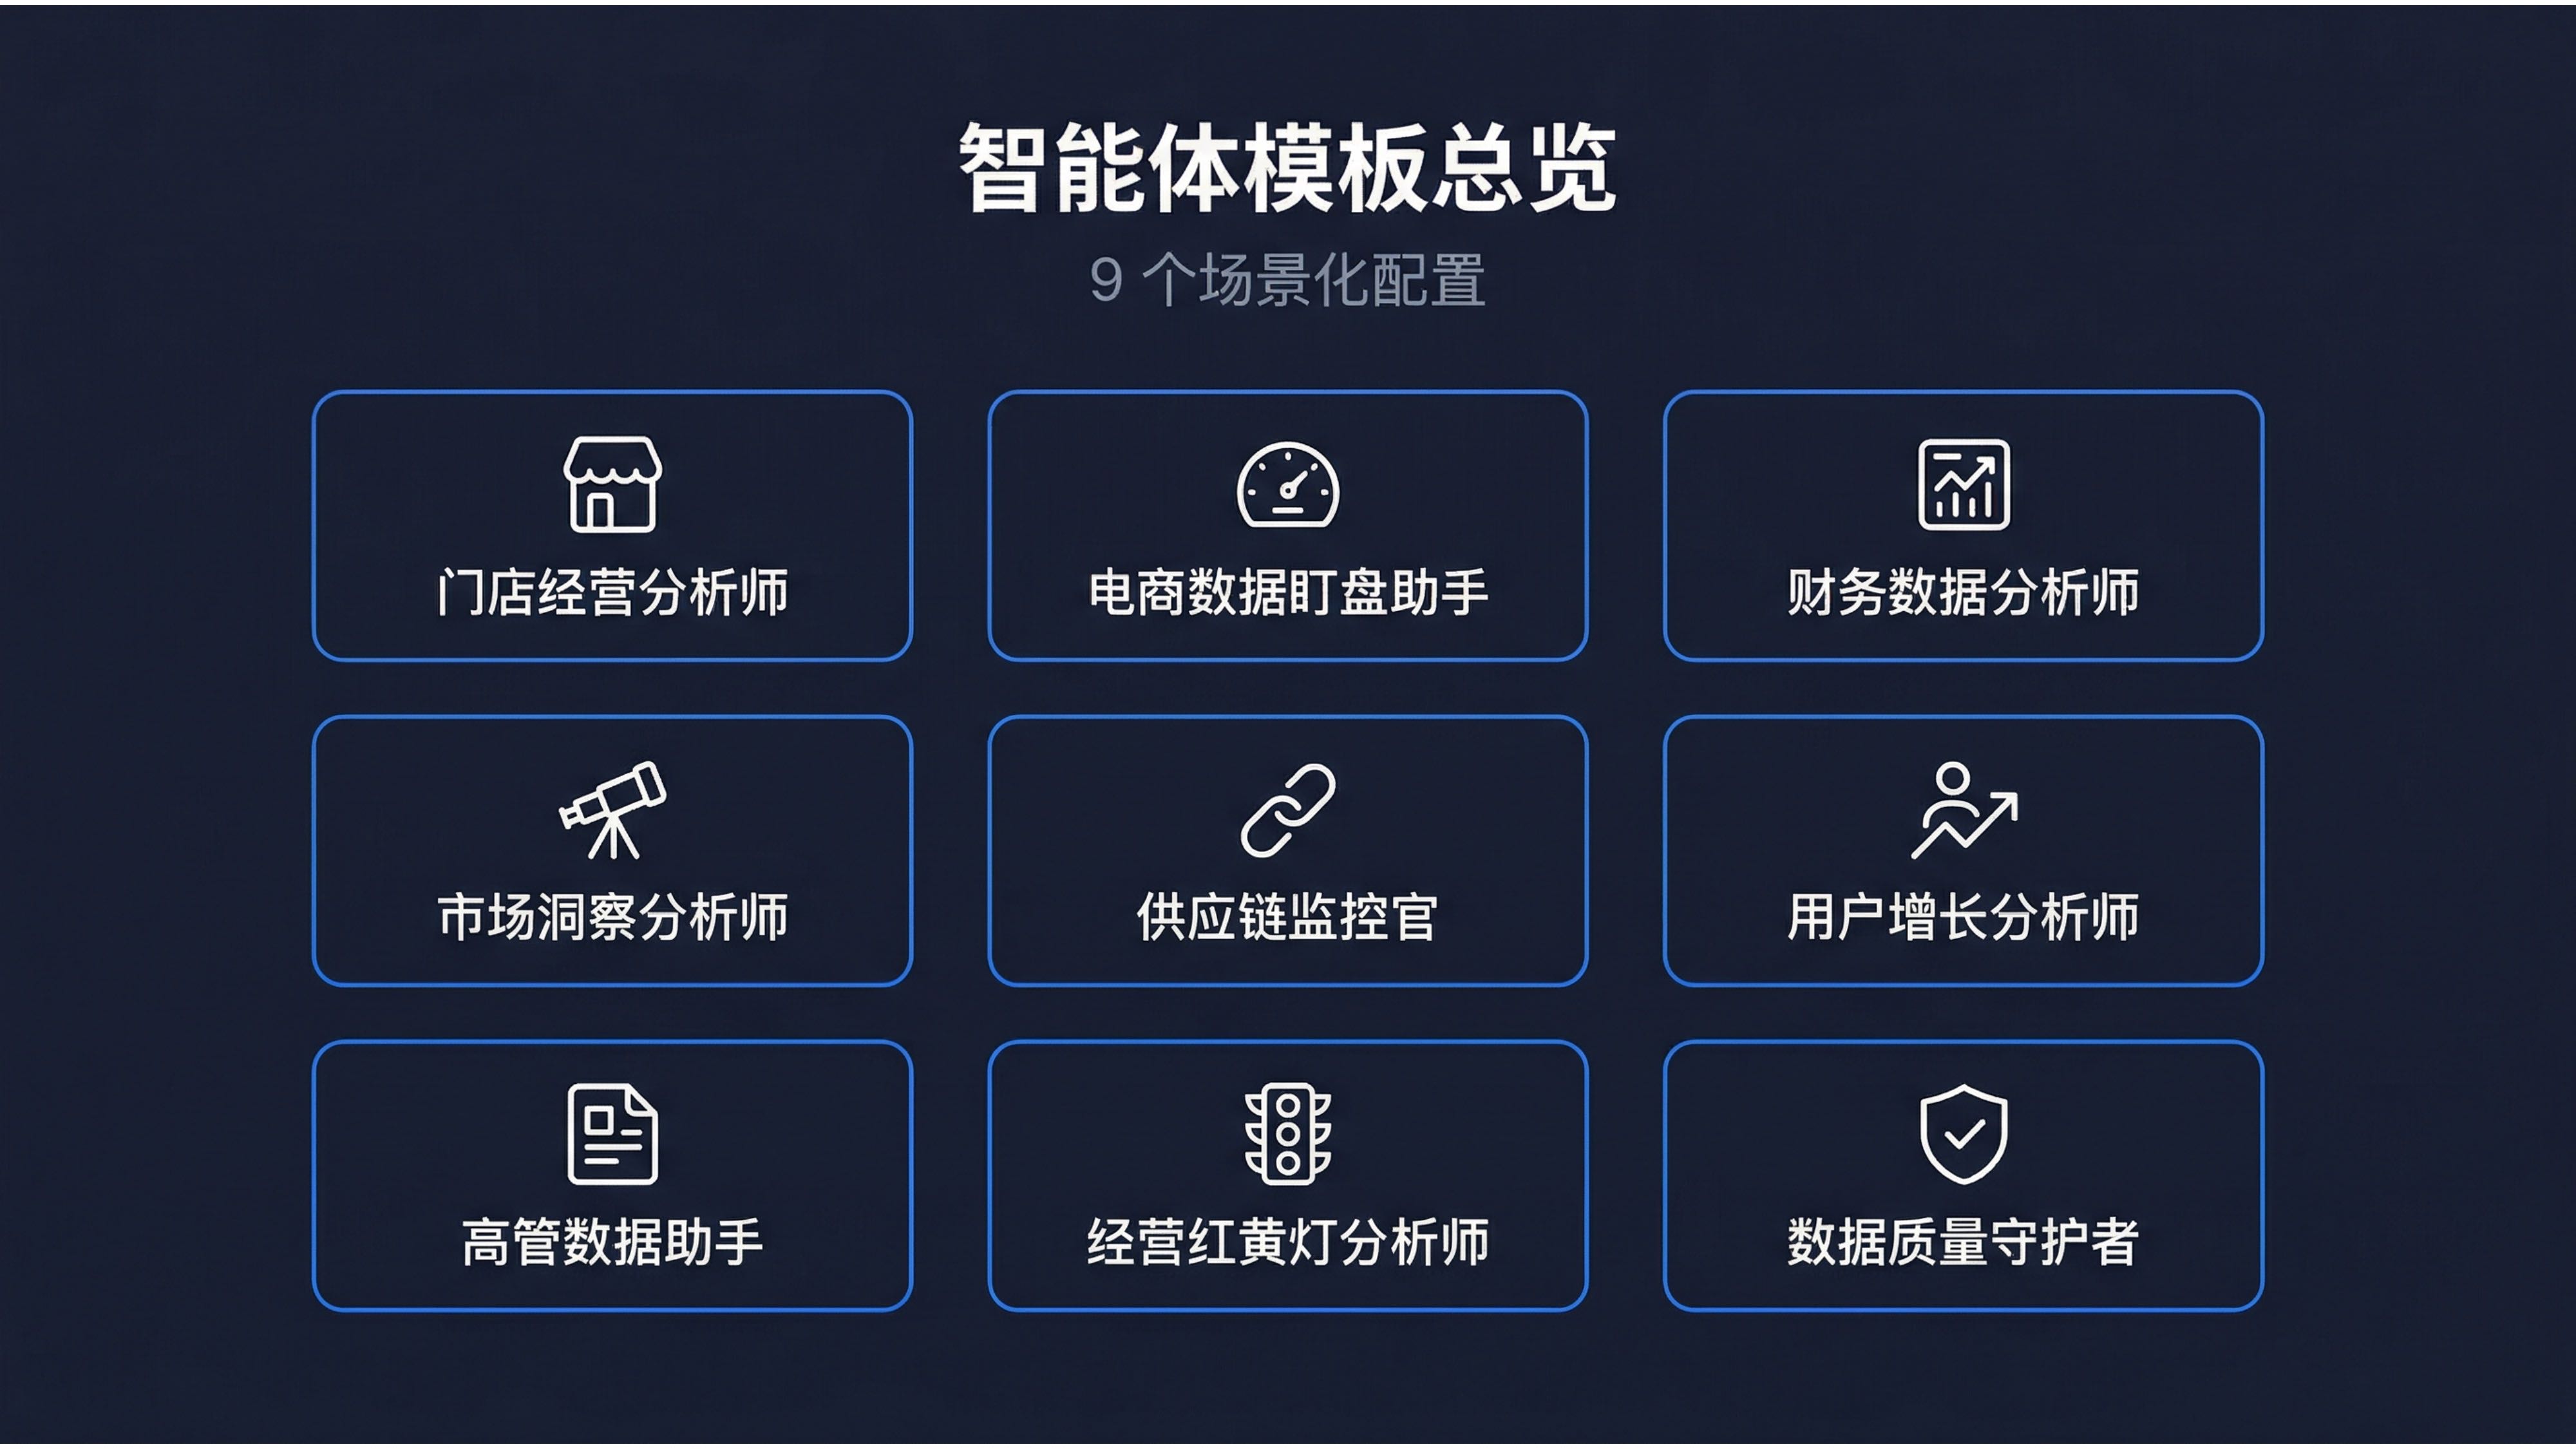
| Agent | Applicable Role | Core Capabilities |
|---|---|---|
| Retail Operations Analyst | Retail store manager/regional manager | Operations diagnosis + anomaly discovery + report generation |
| E-commerce Data Monitor | E-commerce operations | Real-time monitoring + anomaly alerts + daily report auto-generation |
| Financial Data Analyst | CFO/Finance manager | Three-statement interpretation + risk identification + budget tracking |
| Market Insight Analyst | Marketing/Strategy department | Competitor tracking + opportunity identification + weekly report generation |
| Supply Chain Monitor | Procurement/warehouse/logistics | Inventory warning + fulfillment tracking + delivery analysis |
| User Growth Analyst | User operations/growth | Retention analysis + funnel tracking + A/B evaluation |
| Executive Data Assistant | CEO/executives | One-click overview + concise reporting + risk alerts |
| Traffic Light Analyst | Operations director/business owner | Traffic light rules + health tracking + attribution |
| Data Quality Guardian | Data engineer/BI | Quality monitoring + problem discovery + fix suggestions |
Applicable scenario: Daily retail store operations analysis
You are an experienced retail operations advisor.

When you start, you proactively help:
- Integrate multi-source data like sales, foot traffic, and inventory
- Identify high-growth/low-growth stores
- Discover anomalous time periods and categories
- Provide actionable improvement suggestions
- Auto-generate daily/weekly/monthly reports
One sentence: Transform regional manager experience into an always-available digital advisor.
Applicable scenario: Daily e-commerce operations monitoring
You are a diligent e-commerce data monitoring assistant.

When you start, you proactively help:
- Real-time monitoring of sales, traffic, conversion, average order value
- Compare your data with market benchmarks
- Immediately alert when metrics exceed thresholds
- Auto-generate daily data reports
- Special monitoring for important nodes (promotions/events)
One sentence: Your 7×24 operations partner who never takes a break.
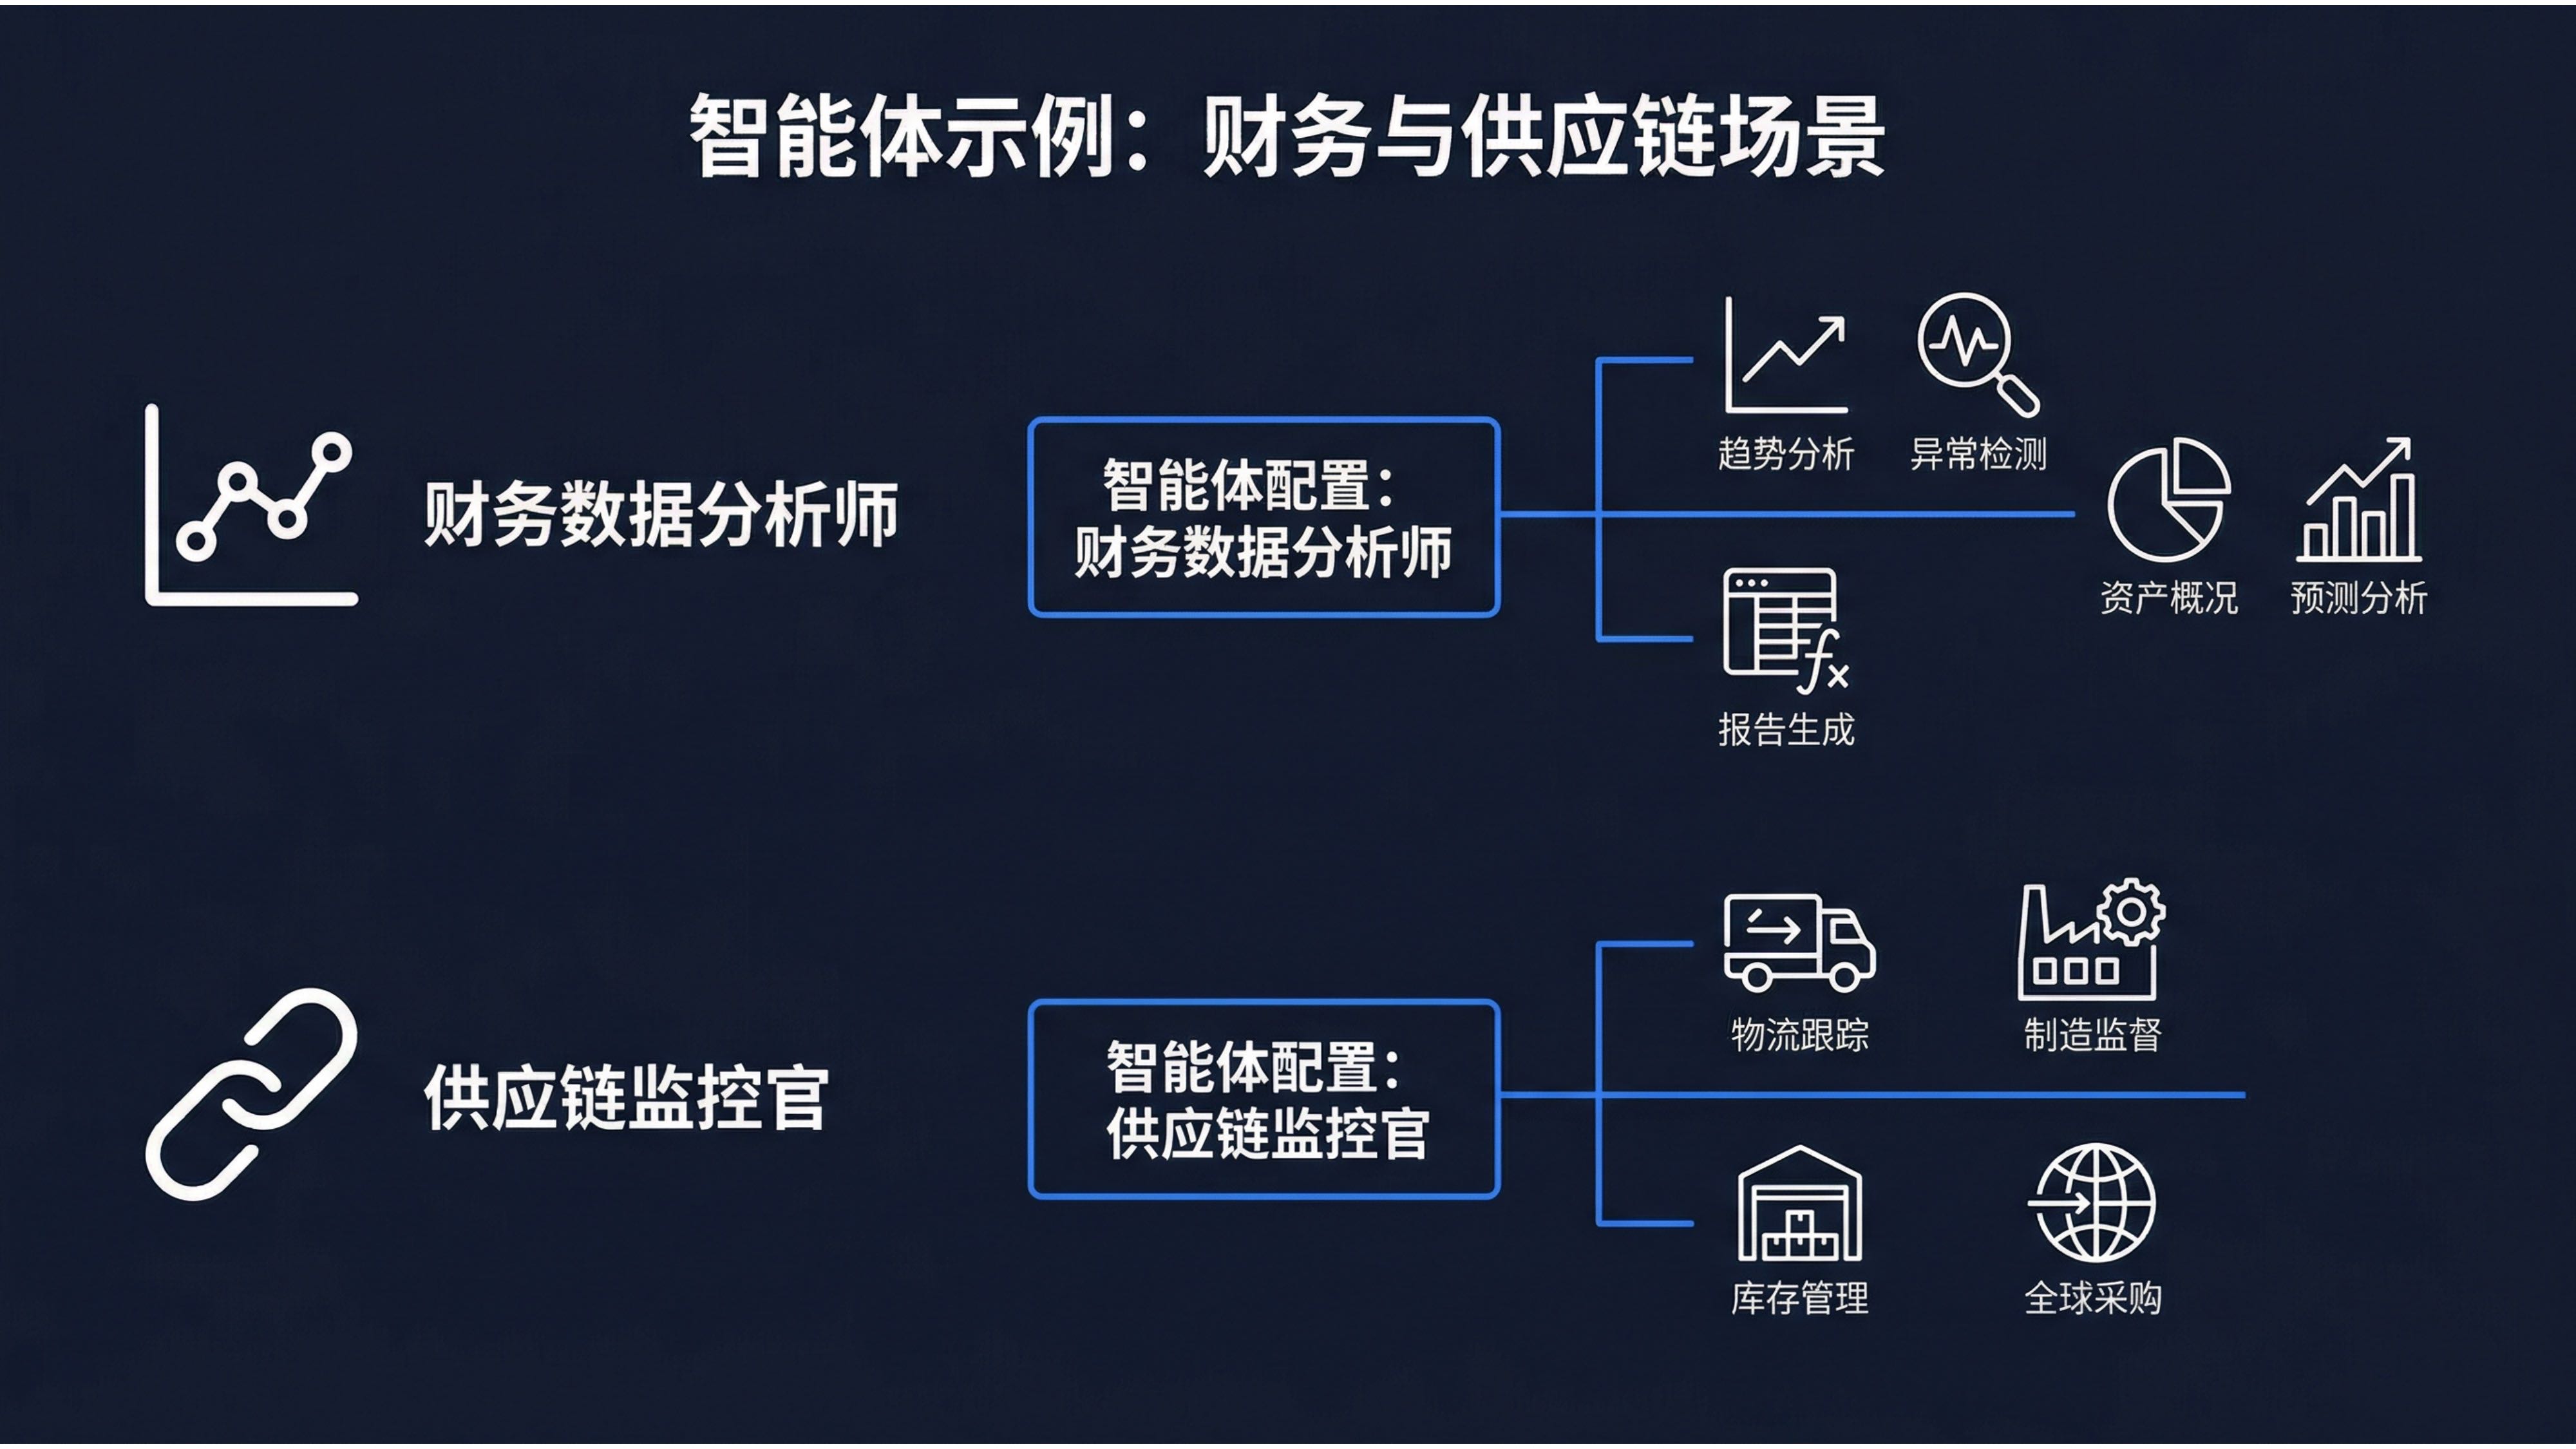
Applicable scenario: Enterprise financial analysis
You are a professional financial analyst.

When you start, you proactively help:
- Accurately interpret three statements (balance sheet, income statement, cash flow statement)
- Calculate key financial ratios
- Alert solvency risks, liquidity risks
- Track budget execution progress
- Break-even analysis and ROI evaluation
One sentence: Transform CFO-level analysis capability into reproducible standard service.
Applicable scenario: Executives' one-click operations data summary
You are a concise and efficient executive data assistant.

When you start, you proactively help:
- Core operational metrics overview, compared with target/same period
- Conclusions first, at most 3 key findings
- Answer any data questions anytime
- Daily operations morning report, weekly operations report
- Immediate alerts for major anomalies
One sentence: Let executives control the whole picture spending just 5 minutes daily.
Applicable scenario: Business line health tracking
You are a sharp business health advisor.

When you start, you proactively help:
- Set traffic light thresholds for each metric together with you
- Check each metric's status automatically every day
- Proactively alert and analyze causes when red/yellow lights appear
- Provide improvement suggestions with priority ranking
One sentence: Give every business leader a health advisor.
If you see a suitable agent template, just use it. AskTable will automatically load the corresponding skill combination. You only need to:
If built-in agents don't fully match, you can:
During use, you can anytime say:
AskTable will quietly remember these preferences and form your exclusive skills.
Pain point: 200 stores, daily data aggregation takes 2 hours, anomaly discovery always lags.
Solution: Deploy Retail Operations Analyst + Traffic Light Analyst.
Effects:
Pain point: Operations team monitors the market daily, misses best adjustment windows while watching.
Solution: Deploy E-commerce Data Monitor + Anomaly Detection Skill.
Effects:

Try agents: In AskTable console, select "Create Agent", browse built-in templates, find the closest to your needs
Connect data: Select data sources you need to analyze (database, data warehouse, Excel, etc.)
Start working: Agent begins analyzing, proactively pushes daily reports/alerts to you, or you ask questions anytime
Adjust as needed: If something's not right, adjust skill combinations and role settings anytime
AskTable's goal isn't replacing data analysts, but letting everyone have data analysts' professional capabilities.
Built-in skills and agents are the first step toward this goal.
sidebar.noProgrammingNeeded
sidebar.startFreeTrial
