AskTable
sidebar.freeTrial

Qwen 3.6 + AskTable + Claude Code: Building a Top-Tier AI Data Analysis Workflow

AskTable Team
AskTable Team 2026-04-05

Intro

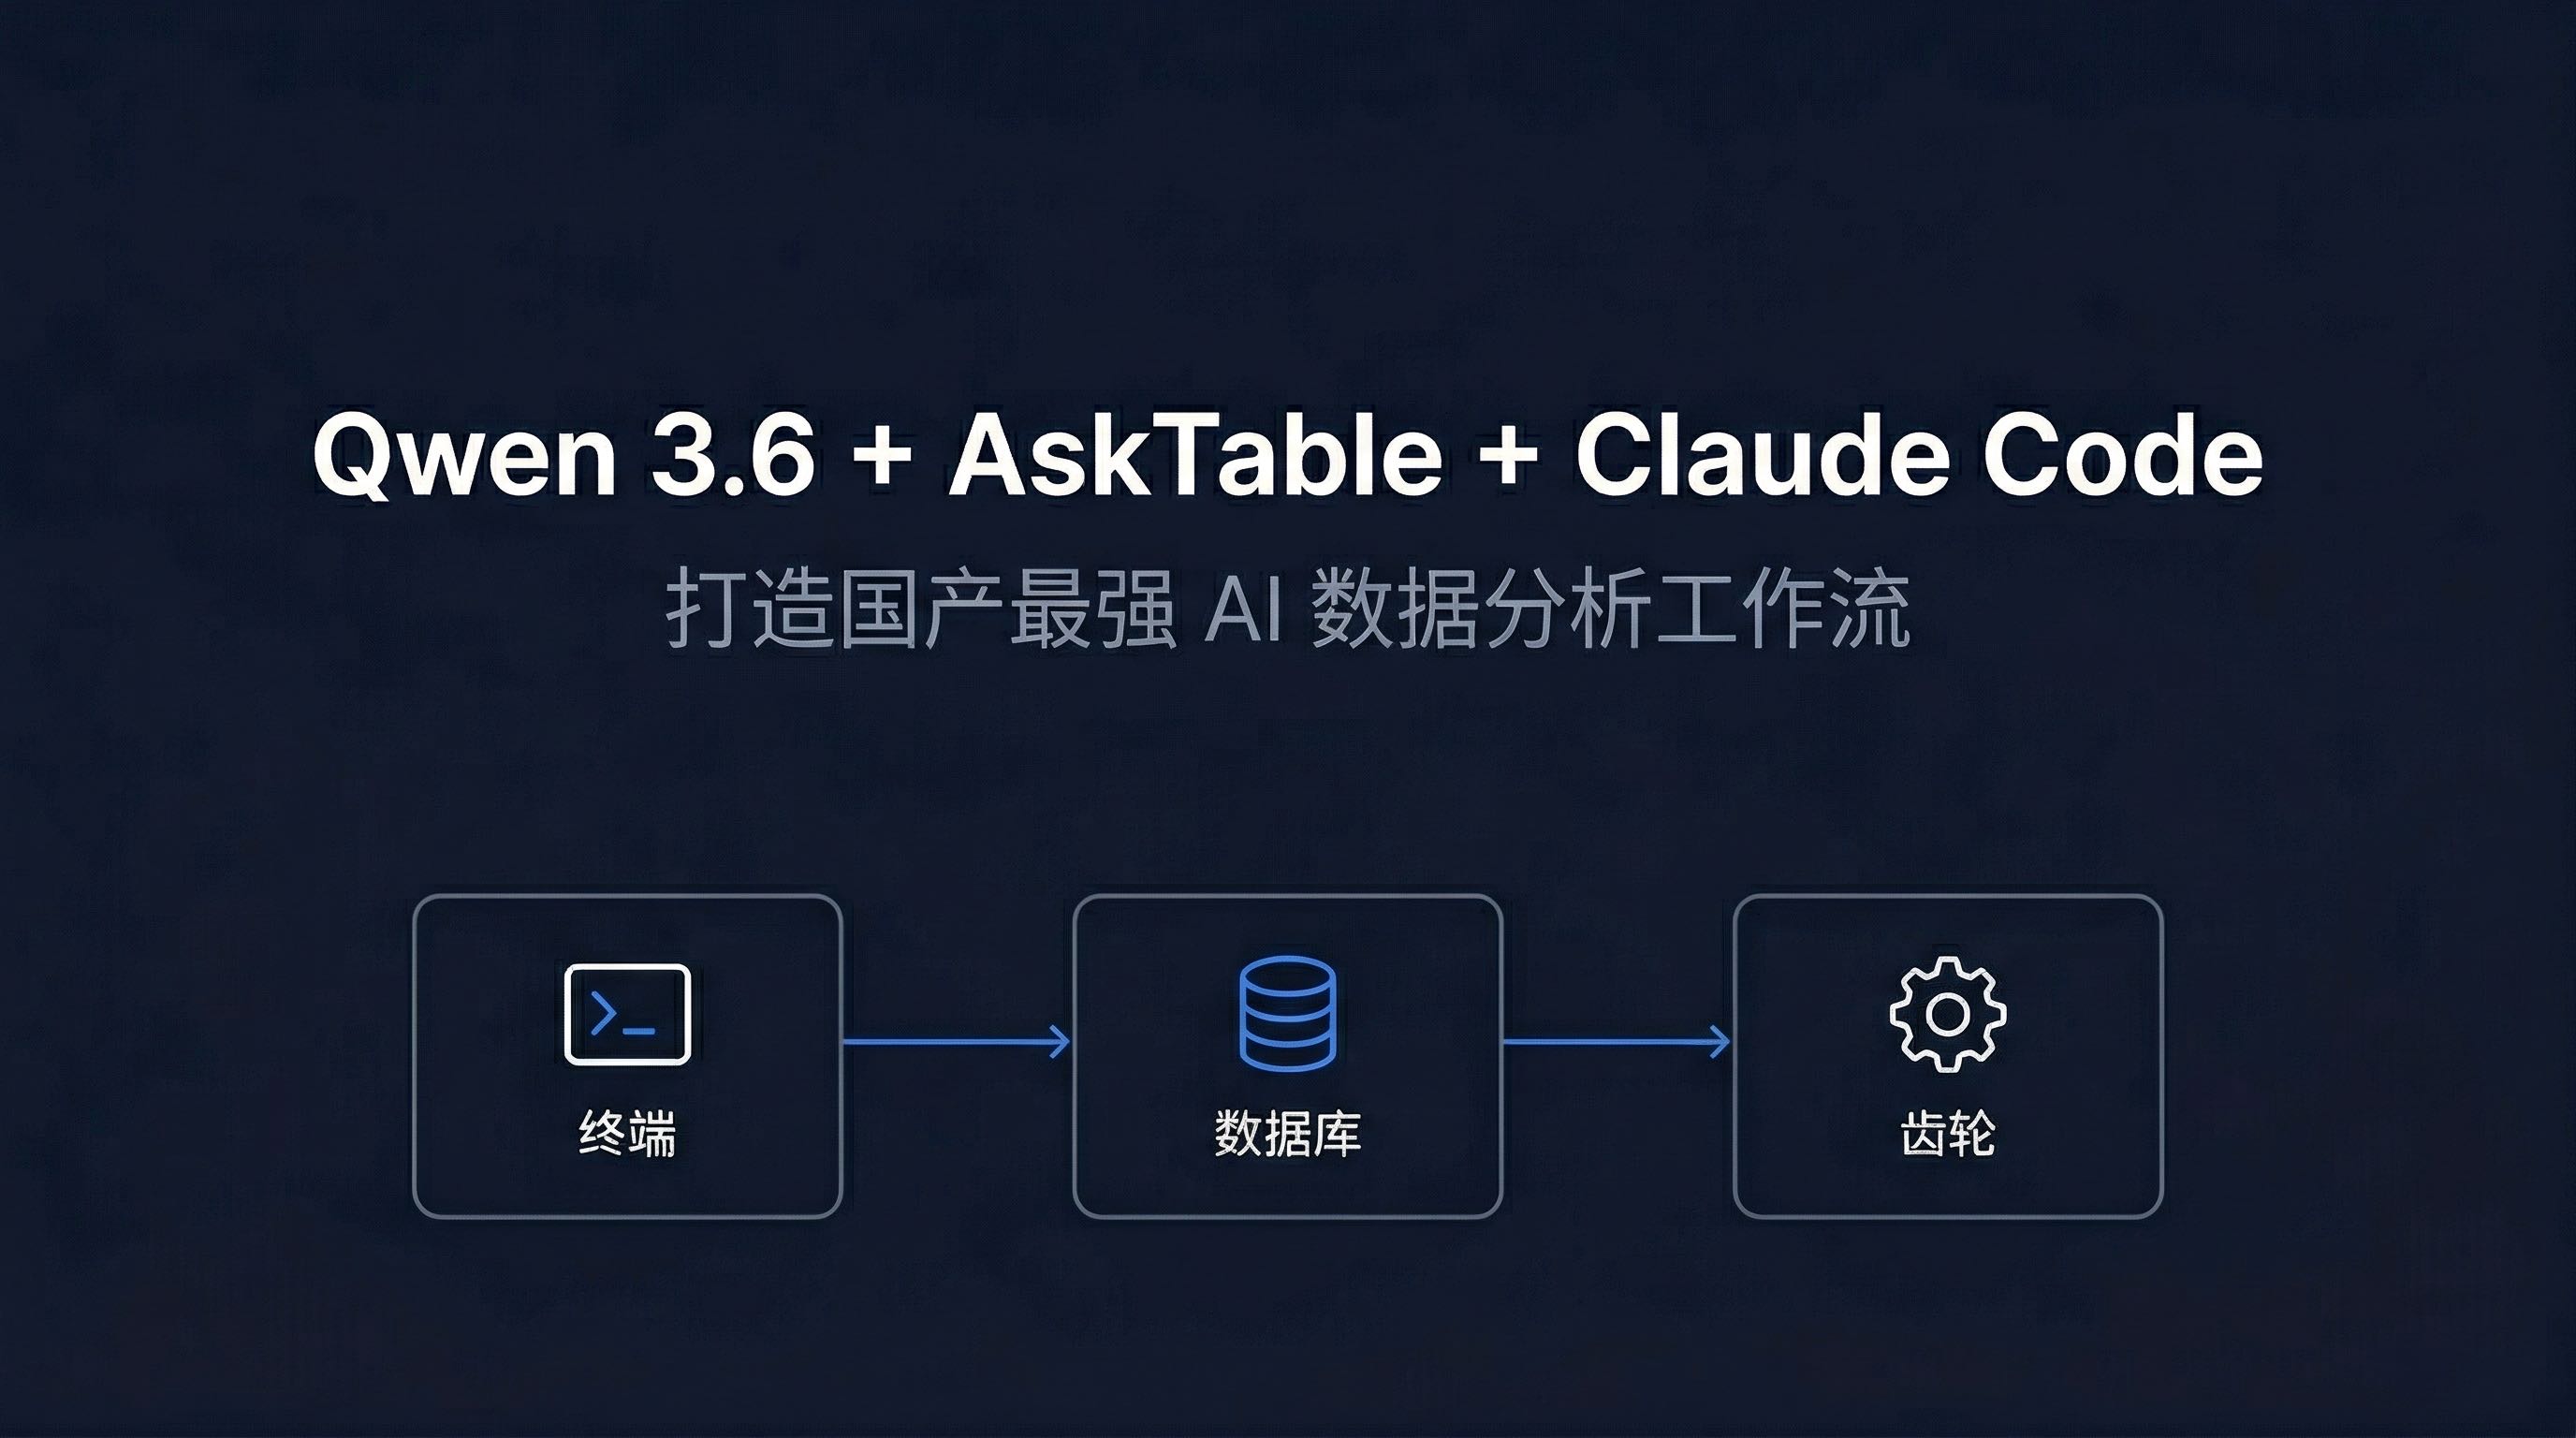
If you want to take data analysis to the extreme, you need three components:

  • Qwen 3.6-Plus: China's strongest programming model, programming capability improved 2-3x, approaching Claude Opus 4.5 level
  • AskTable: AI data analysis platform, supporting 20+ database types, Text-to-SQL / Text-to-Python / Text-to-JS three-channel intelligent analysis
  • Claude Code: AI programming assistant, managing data and executing analysis through AskTable Skill

Each is strong on its own, combined they form a complete AI data analysis workflow.

This article is a hands-on tutorial, walking you through building this workflow from scratch, completing the full chain from data integration, intelligent analysis, report generation to team collaboration.


I. Architecture Overview: Engine + Hub + Entry Point

Before getting hands-on, understand what role each of these three components plays.

Arch

Qwen 3.6-Plus: Intelligence Engine

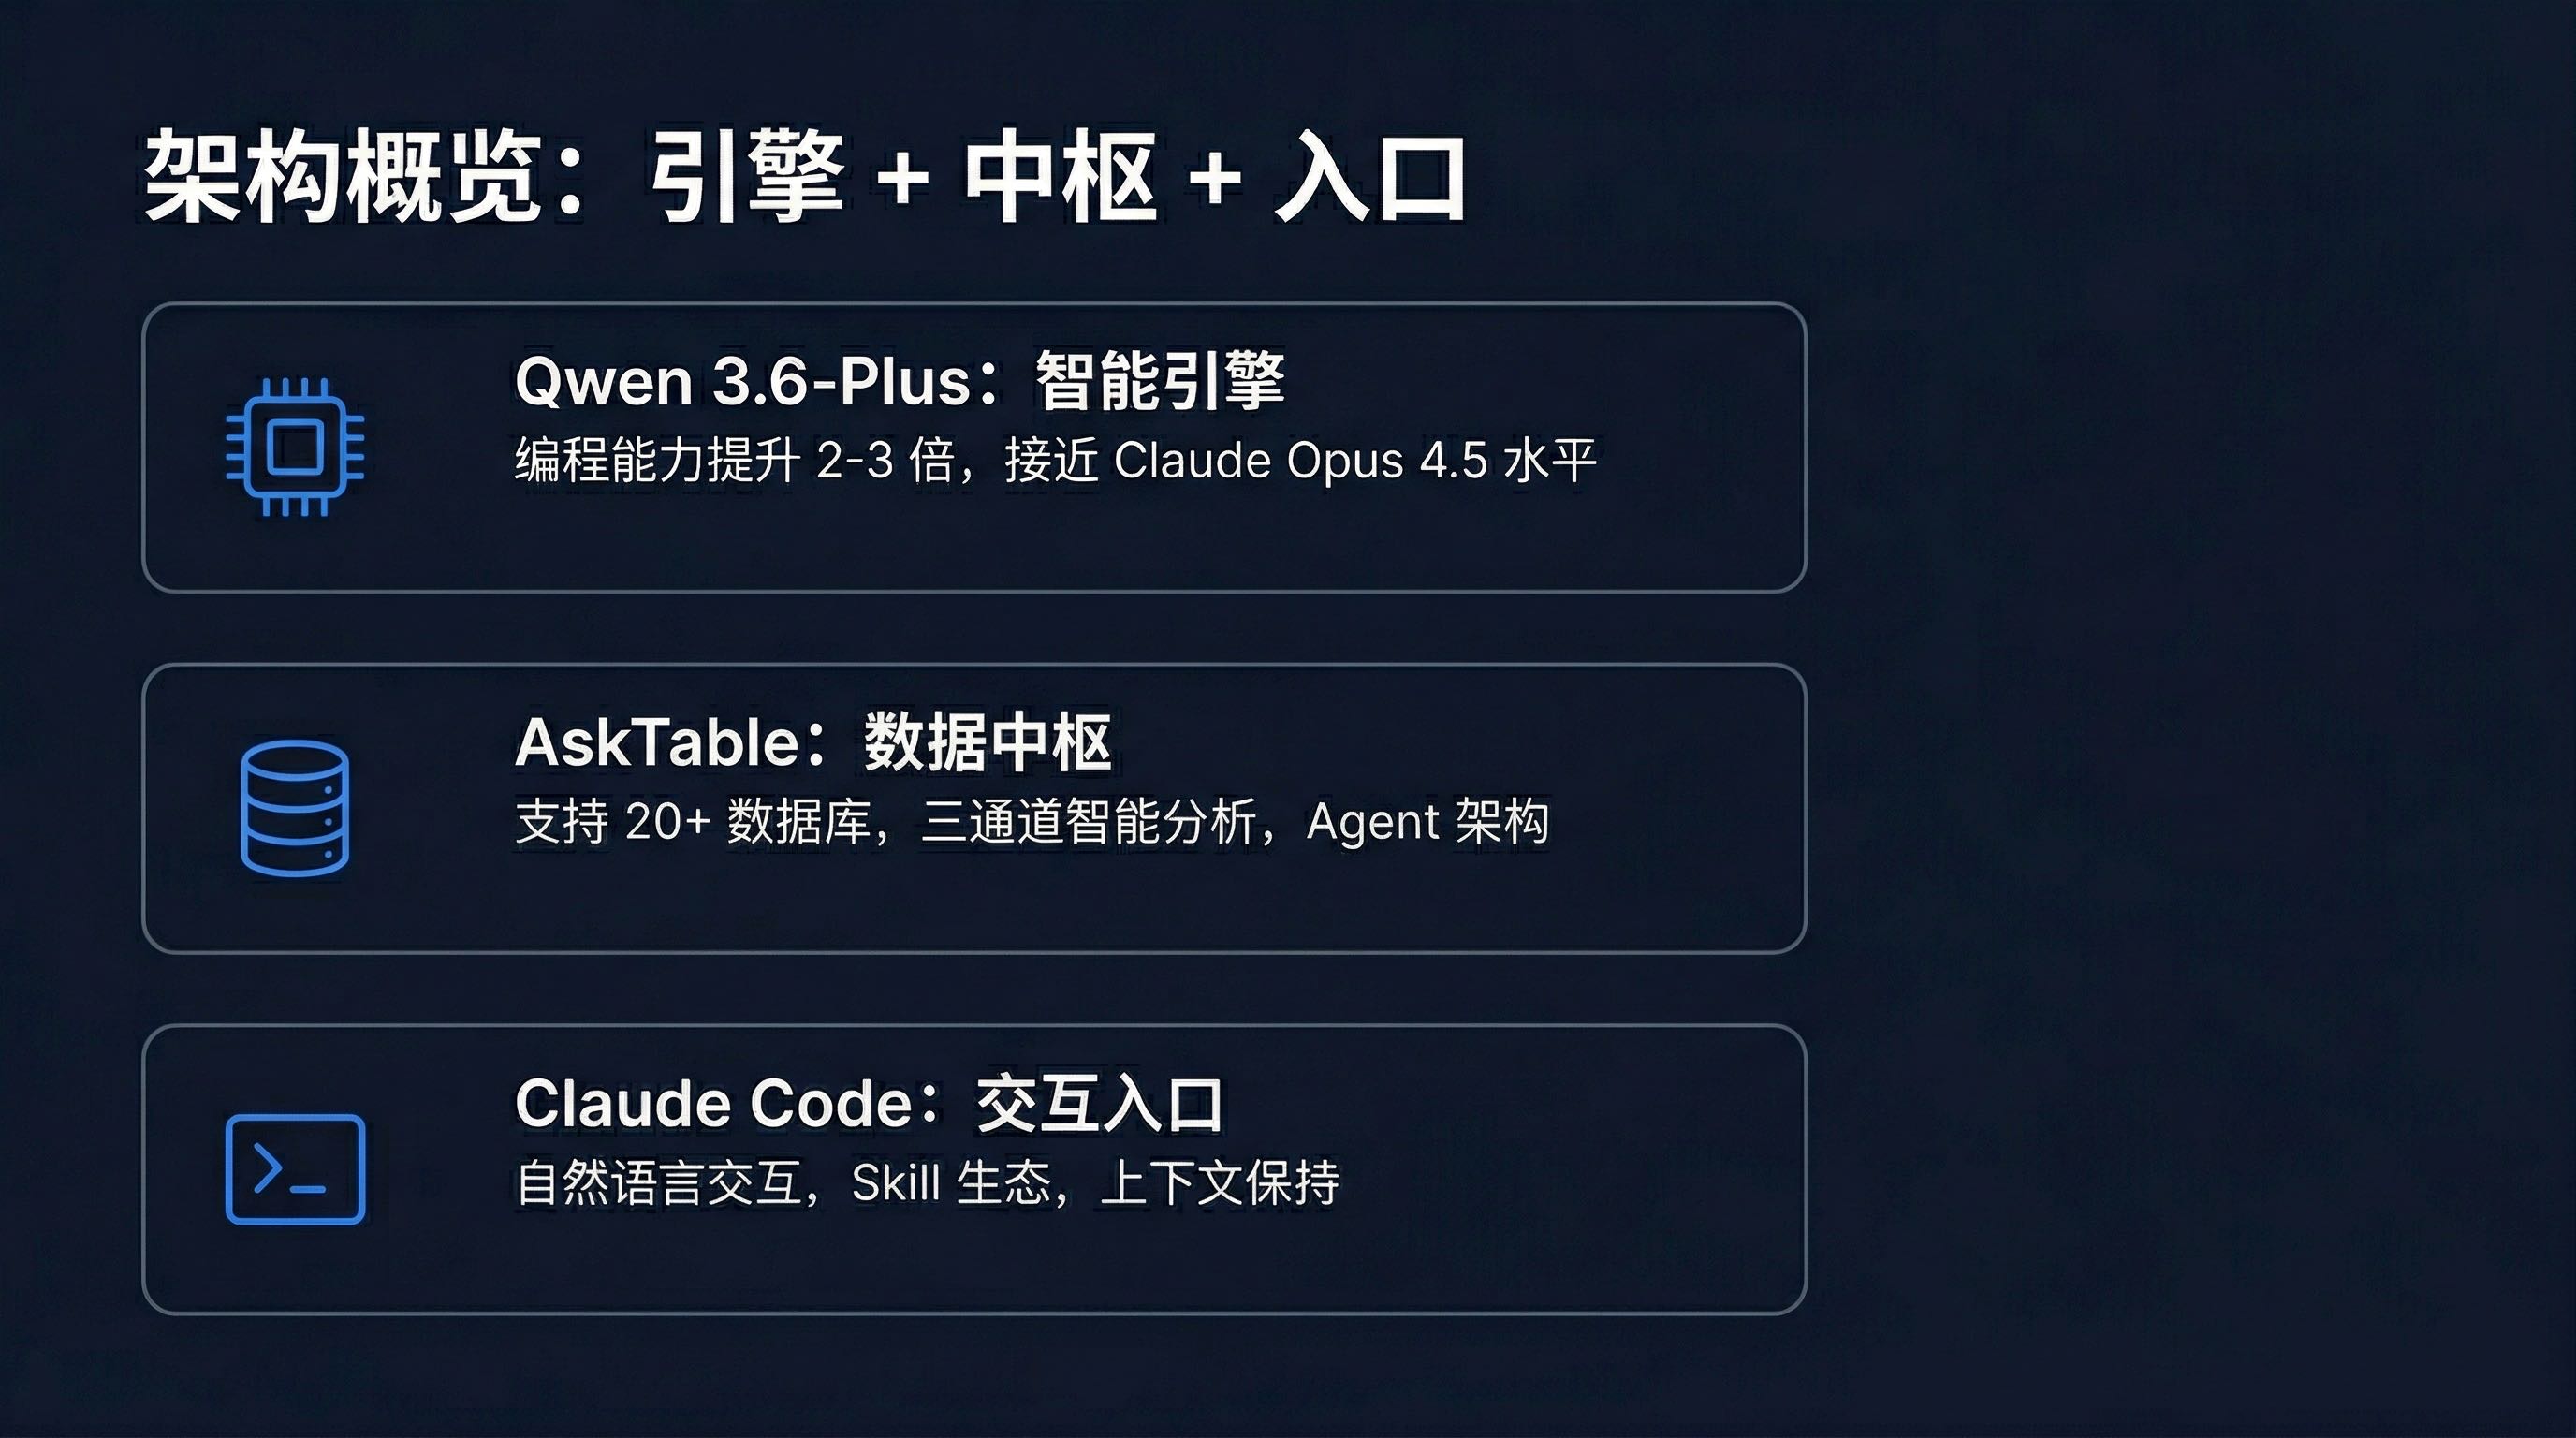
Qwen 3.6-Plus is the underlying power engine for this workflow. Its core value lies in:

  • Programming capability leap: 2-3x improvement over previous generation, complex code generation accuracy approaching Claude Opus 4.5
  • Enhanced reasoning: Significantly improved logical reasoning and pattern recognition in data analysis scenarios
  • Controllable cost: As a domestic model, achieving good balance between performance and cost
  • Strong Chinese understanding: Better understanding of Chinese business scenarios and industry terminology than most foreign models

For details on Qwen 3.6-Plus integration with AskTable, see AskTable First to Support Qwen 3.6-Plus.

AskTable: Data Hub

AskTable is the data analysis and memory hub for this workflow. Its core value lies in:

  • Wide connectivity: Supporting 20+ data sources including MySQL, PostgreSQL, Oracle, SQL Server, MongoDB, Elasticsearch
  • Three-channel analysis: Text-to-SQL for query problems, Text-to-Python for complex analysis, Text-to-JS for frontend visualization
  • Agent architecture: Built-in AI Agent system supporting skill invocation, memory management, multi-step reasoning
  • Team collaboration: Multi-user sharing of Agent memory and skills, analysis capabilities can be inherited

For AskTable's Agent architecture design, see AskTable AI Agent Working Principles.

Claude Code: Interaction Entry Point

Claude Code is the unified interaction entry point for this workflow. Its core value lies in:

  • Natural language interaction: Complete the entire data analysis process through Chinese conversation
  • Skill ecosystem: Seamlessly invoke data analysis capabilities through AskTable Skill
  • Context preservation: Maintain analysis context across multi-turn conversations, supporting iterative exploration
  • Reusability: Analysis processes and results can be saved and shared in code form

For integration details between Claude Code and AskTable, see Claude Code + AskTable Integration Guide.

Overall Architecture Diagram

Arch

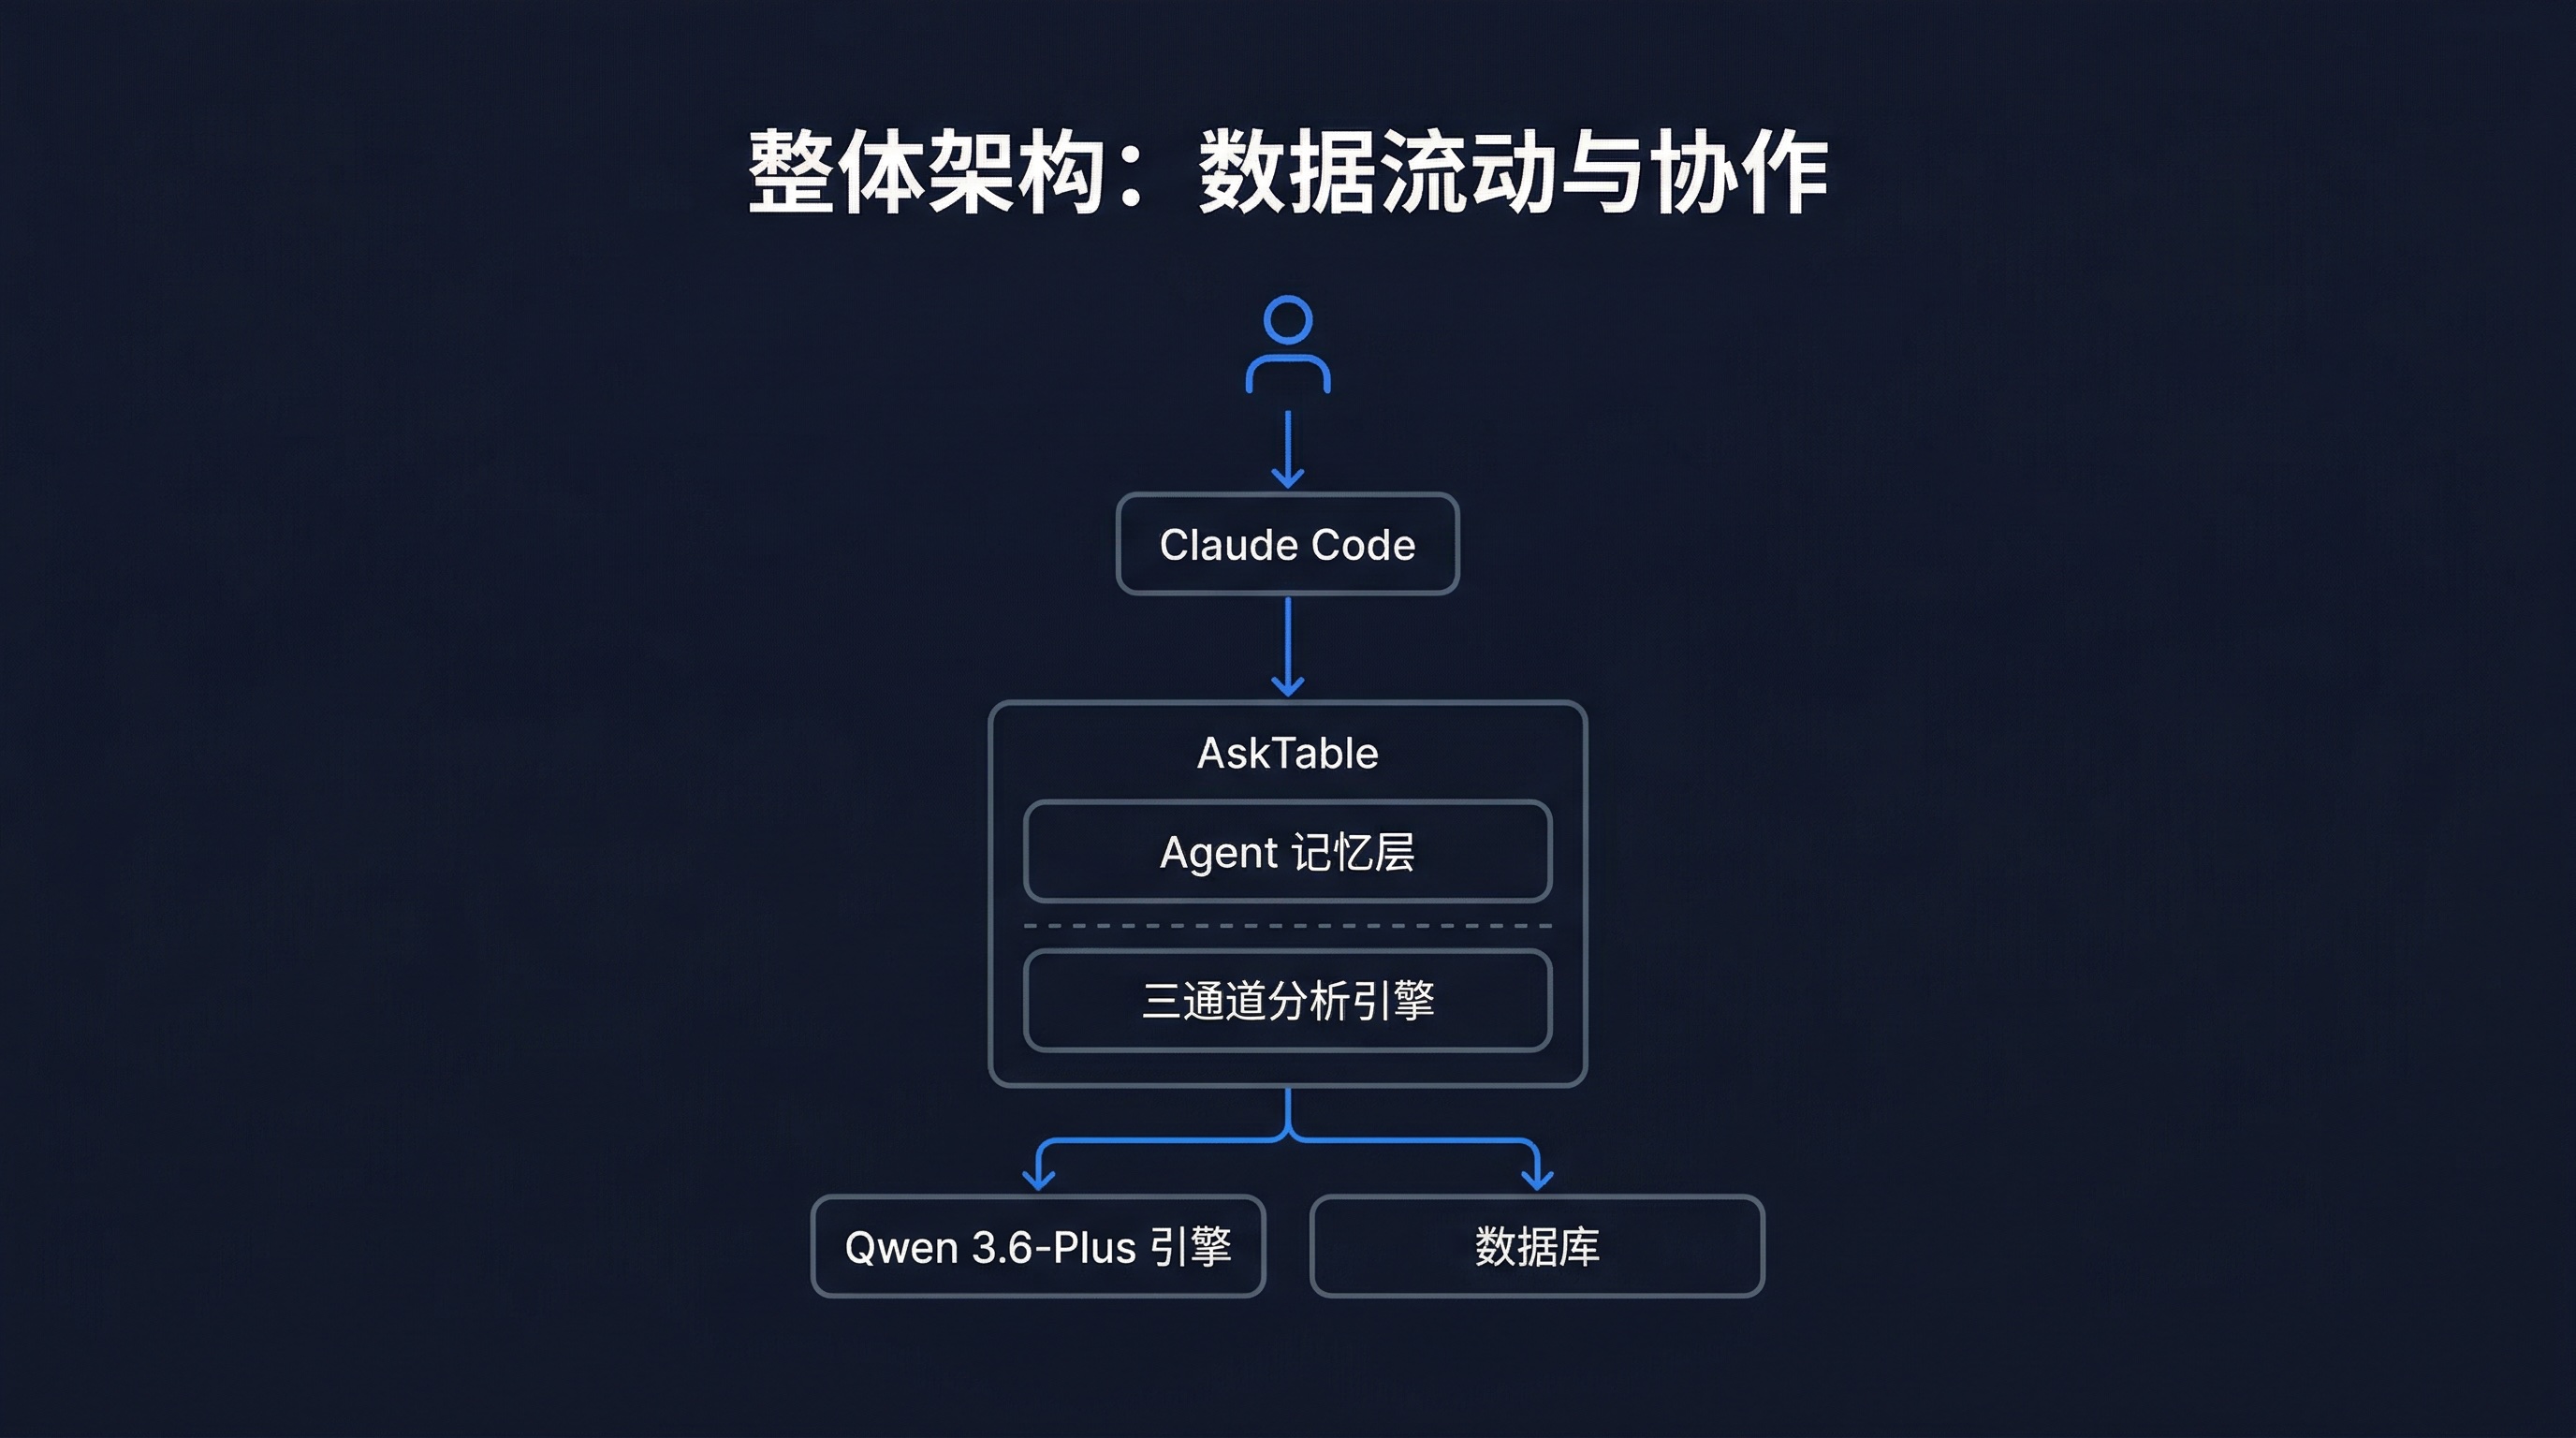
The design philosophy of this architecture is: let each component do what it does best.

  • Claude Code excels at understanding user intent and managing conversation context
  • AskTable excels at connecting data, executing analysis, and managing Agent memory
  • Qwen 3.6-Plus excels at generating SQL, Python code and logical reasoning

Next, let's build this workflow step by step.


II. Environment Setup: 5 Minutes

Step 1: Install AskTable CLI

Open your terminal and execute:

# Install AskTable CLI globally
npm i -g @datamini/asktable-cli

# Verify installation
asktable --version

Step 2: Log into AskTable

asktable login

Follow the prompts to enter your AskTable account information. If you don't have an AskTable account yet, you can register on the official website first.

Step 3: Get AskTable Skill

# Get AskTable Skill and install to Claude Code
asktable get-skill

This command will automatically install AskTable Skill into your Claude Code environment. After installation, you can directly use AskTable's data analysis capabilities in Claude Code.

Step 4: Confirm Model Configuration

In the AskTable backend, ensure you have selected Qwen 3.6-Plus as the underlying analysis model.

Go to AskTable settings page, select "Qwen 3.6-Plus" in "Model Configuration" and save.

If you haven't configured Qwen 3.6-Plus yet, reference AskTable First to Support Qwen 3.6-Plus to complete configuration.

Environment Checklist

  • AskTable CLI installed (asktable --version has output)
  • AskTable logged in (asktable status shows connected)
  • AskTable Skill installed to Claude Code
  • AskTable backend configured with Qwen 3.6-Plus model

III. Complete Analysis Task

AskTable Task

Step 1: Data Integration

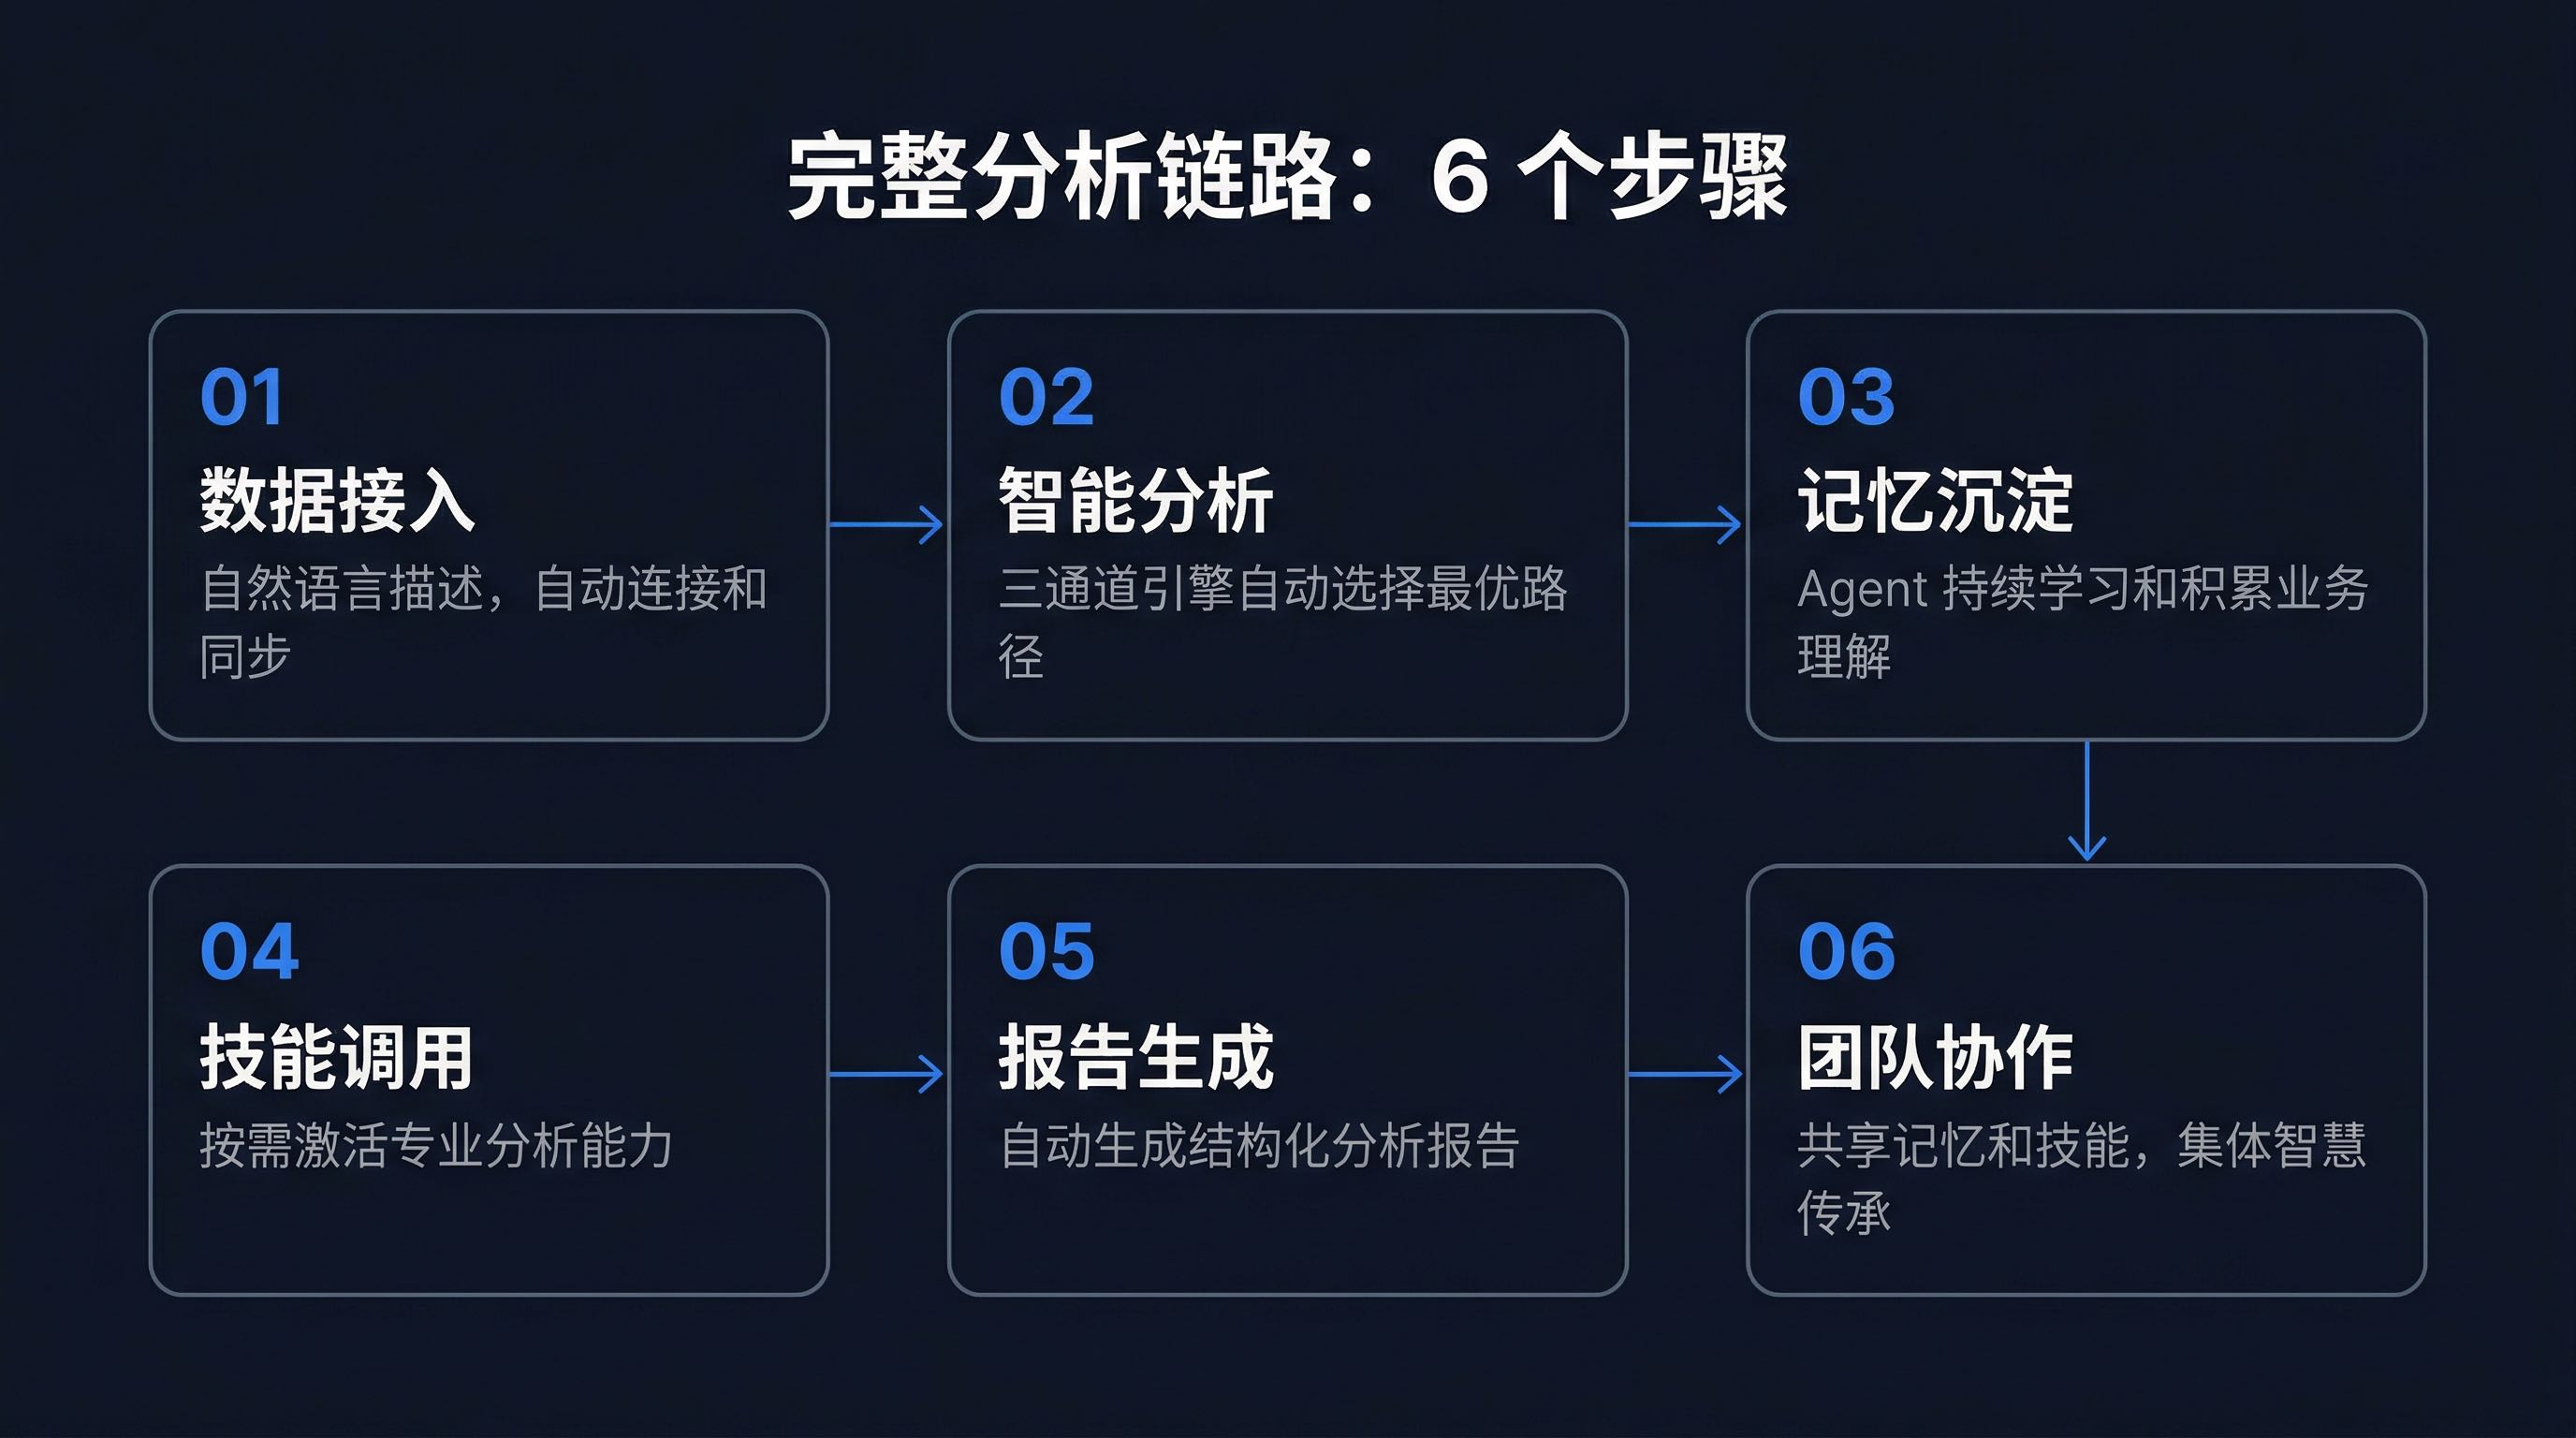
The first step in data analysis is getting data in. AskTable supports 20+ data sources, covering almost all mainstream databases and file formats.

Connecting Relational Databases

Using MySQL as an example, directly say in Claude Code:

Help me connect to the database:
- Type: MySQL
- Address: 192.168.1.100:3306
- Database: sales_db
- Username: analyst
- Password: your_password

AskTable Skill will call AskTable API to complete:

  1. Establish connection: Create datasource connection configuration
  2. Test connectivity: Verify database is accessible
  3. Metadata sync: Automatically scan all table structures, field information, index relationships
  4. Smart labeling: Automatically generate Chinese business labels based on field names and data samples

Importing Excel / CSV Files

If you have local files:

Help me import this Excel file:
- File path: /Users/jeffrey/data/monthly_sales.xlsx
- Worksheet name: January

AskTable will automatically:

  • Identify headers and data structure
  • Infer field types (numeric, text, date)
  • Detect anomalies and data quality issues
  • Generate data preview

Multi-Source Management

AskTable supports connecting multiple datasources simultaneously. You can:

List all datasources I'm currently connected to

AskTable will return something like:

📊 Currently Connected Datasources (3):

1. 🗄️ Sales Database (MySQL)
   - Database: sales_db
   - Table count: 12
   - Status: Connected
   - Last sync: 2026-04-05 10:30

2. 📄 Monthly Report (Excel)
   - File: monthly_sales.xlsx
   - Worksheets: 3
   - Status: Imported
   - Import time: 2026-04-05 09:15

3. 🔍 User Behavior Data (Elasticsearch)
   - Index: user_behavior_*
   - Document count: ~2.3M
   - Status: Connected
   - Last sync: 2026-04-05 08:00

Design Considerations

Why complete data integration in Claude Code?

Traditional BI tools typically require you to manually configure connection parameters, select tables, and define relationships in a graphical interface. This process might be quick for those familiar with databases, but creates a high barrier for business people.

Describing requirements in natural language in Claude Code, AskTable Skill automatically converts to configuration operations. This lowers the barrier to data integration, allowing more people to participate in data analysis.


Step 2: Intelligent Analysis

After data integration is complete, you can start analyzing. AskTable's three-channel analysis engine automatically selects the optimal path based on question type.

AskTable

Text-to-SQL: Query Problems

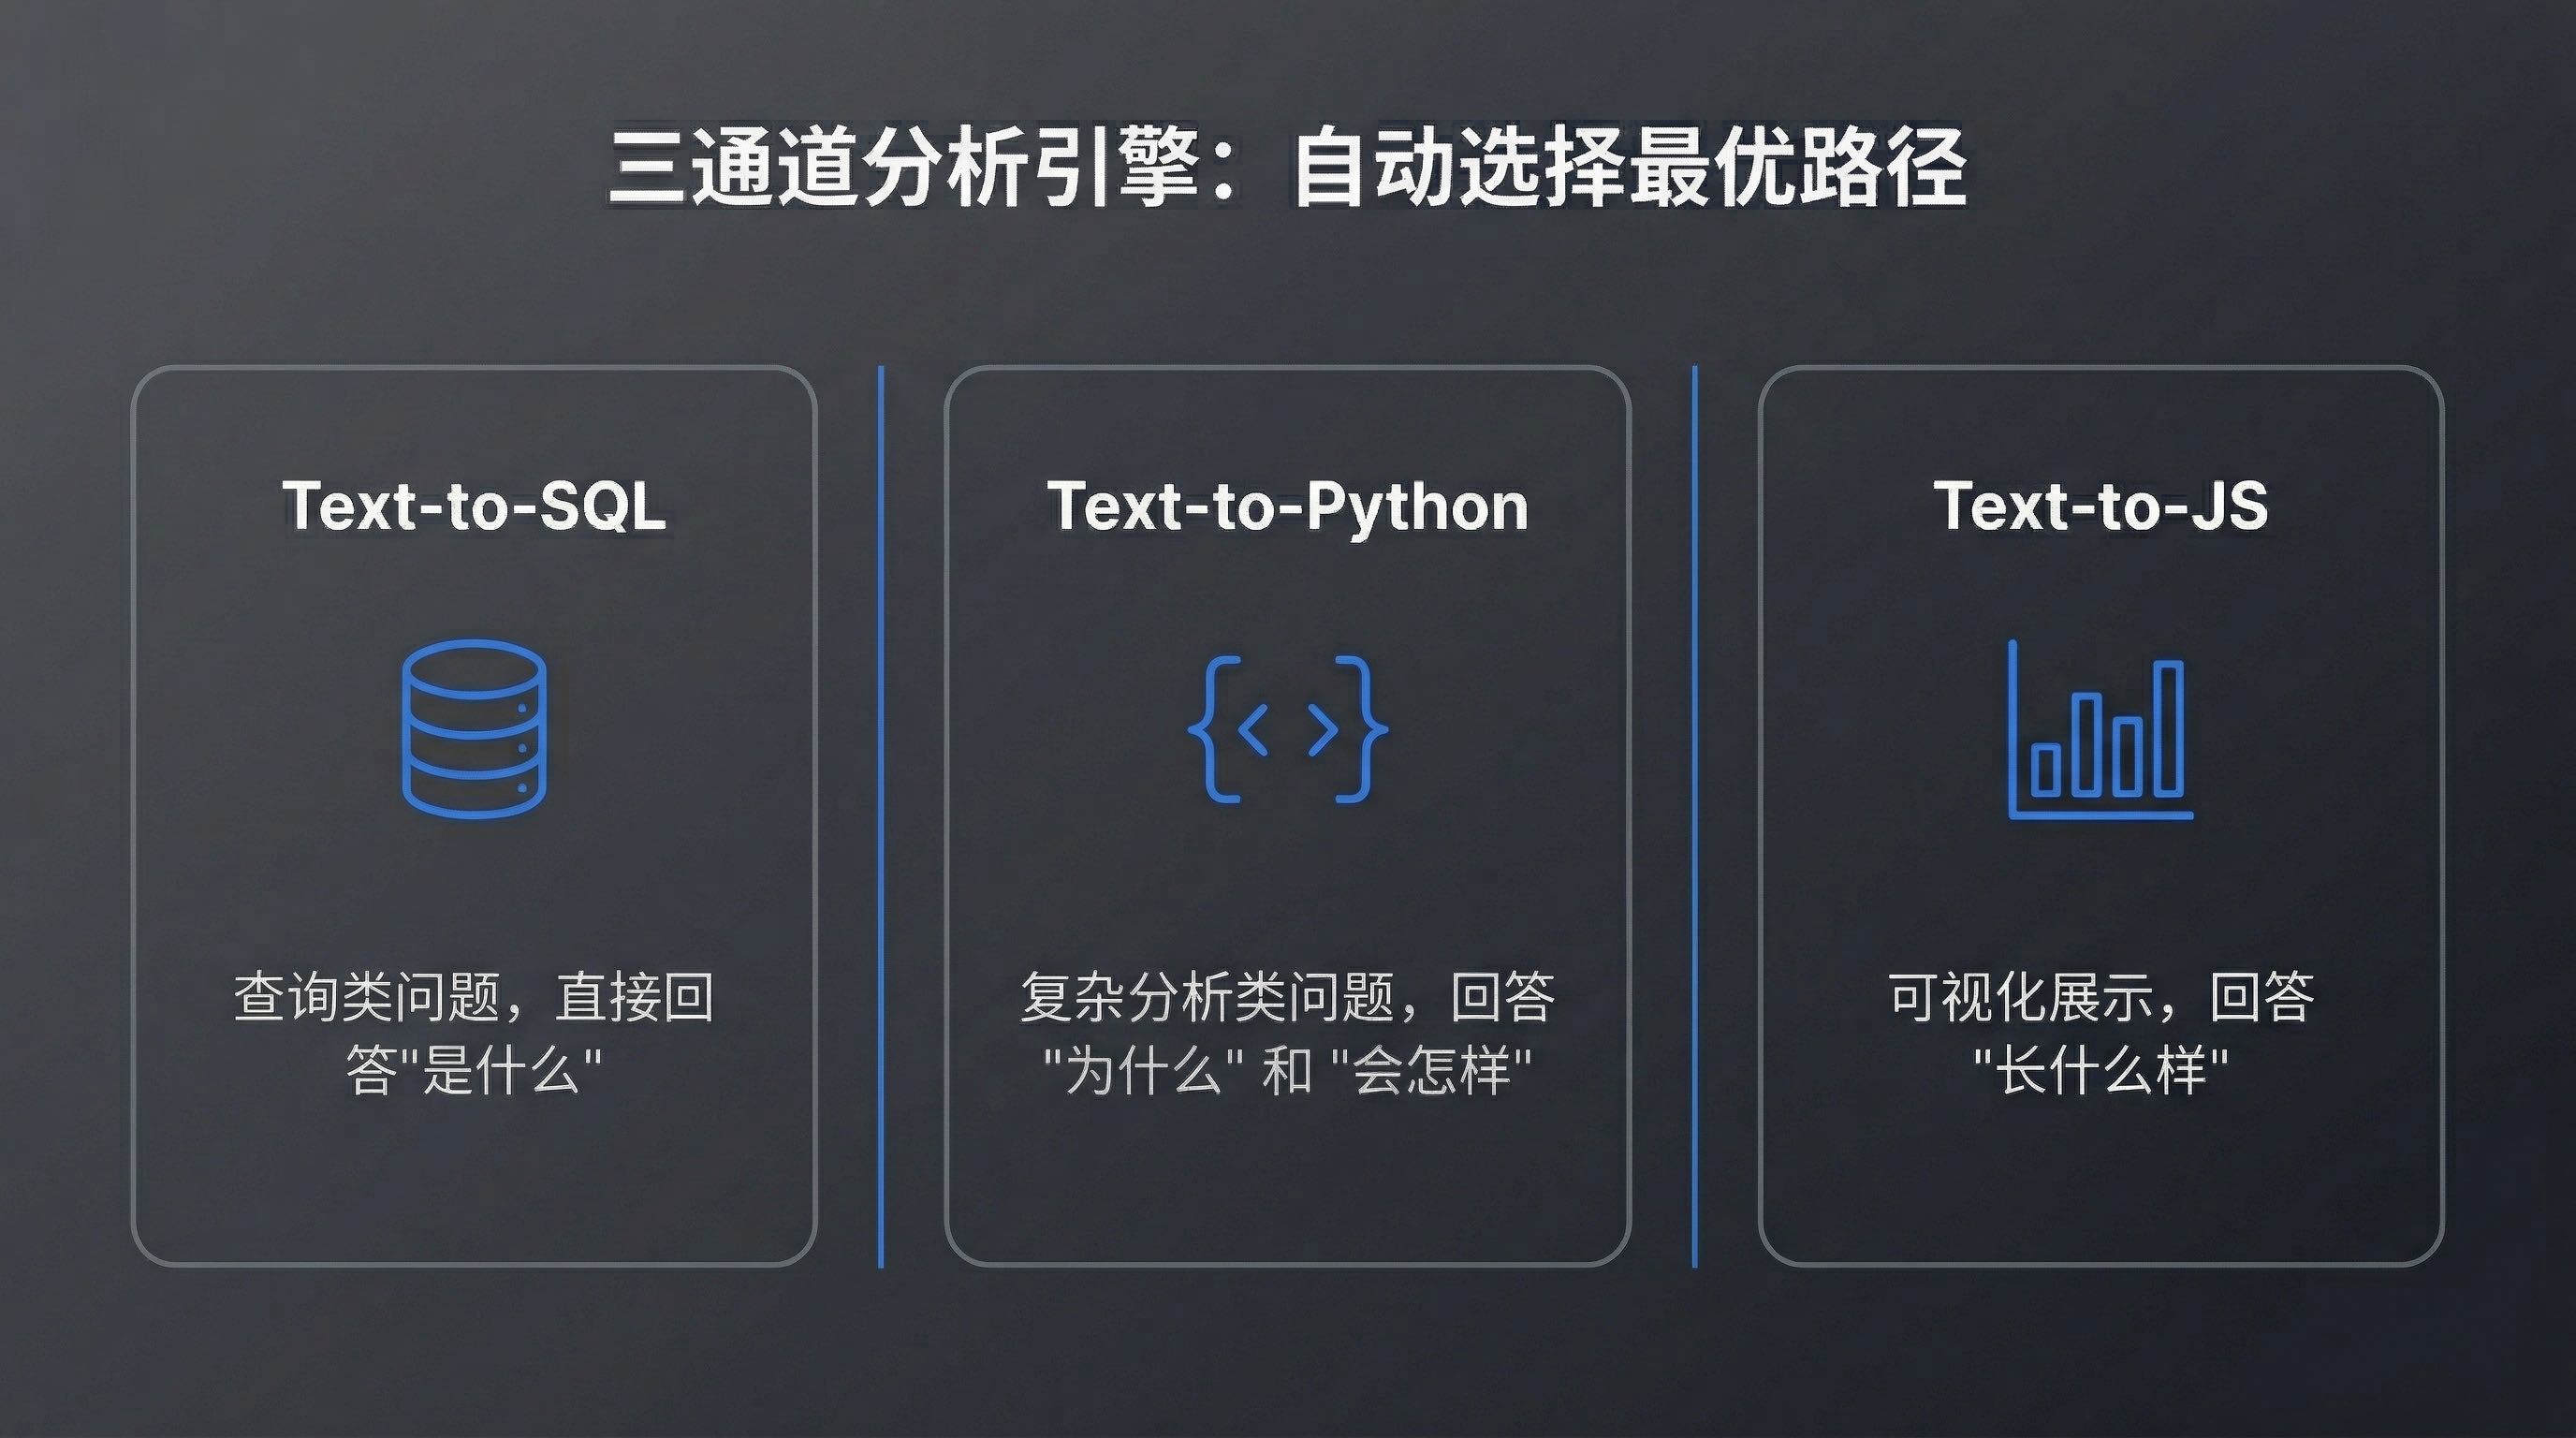
When you ask a question that can be answered directly with SQL, AskTable takes the Text-to-SQL channel:

What were the sales and profit for each product line last month?

AskTable will:

  1. Understand your question intent
  2. Generate corresponding SQL query (using Qwen 3.6-Plus)
  3. Execute query and get results
  4. Automatically select most suitable chart for display

SQL generated by Qwen 3.6-Plus similar to:

SELECT
  p.category_name AS 产品线,
  SUM(o.amount) AS 销售额,
  SUM(o.profit) AS 利润,
  ROUND(SUM(o.profit) / SUM(o.amount) * 100, 1) AS 利润率
FROM orders o
JOIN products p ON o.product_id = p.id
WHERE o.order_date >= '2026-03-01'
  AND o.order_date < '2026-04-01'
GROUP BY p.category_name
ORDER BY 销售额 DESC;

Return results similar to:

📊 2026 March Sales Data by Product Line:

┌──────────────┬────────────┬────────────┬──────────┐
│ Product Line │ Sales(10K) │ Profit(10K)│ Margin   │
├──────────────┼────────────┼────────────┼──────────┤
│ Electronics  │ 2,340      │ 468        │ 20.0%    │
│ Apparel      │ 1,856      │ 557        │ 30.0%    │
│ Home & Living│ 1,230      │ 246        │ 20.0%    │
│ Food & Bev   │ 980        │ 147        │ 15.0%    │
└──────────────┴────────────┴────────────┴──────────┘

💡 Insight: Apparel has highest profit margin (30%), electronics has highest sales but moderate margin.

Qwen 3.6-Plus advantages in Text-to-SQL:

  • Accurate complex JOIN understanding: Correctly infers join keys and filter conditions in multi-table joins
  • Business semantic mapping: Understands business expressions like "last month" and "each product line"
  • SQL optimization: Generated SQL is not only correct but also considers query performance
  • Error self-repair: If SQL execution error occurs, can automatically analyze error message and retry

Text-to-Python: Complex Analysis Problems

When problems involve statistical analysis, machine learning, or complex calculations, AskTable switches to Text-to-Python channel:

Help me analyze the month-over-month trend of sales over the past 6 months, and predict the possible range for next month

AskTable will:

  1. Generate Python analysis script (pandas + statsmodels)
  2. Execute time series analysis
  3. Calculate month-over-month growth rate
  4. Make short-term prediction based on ARIMA model
  5. Generate visualization charts

Python code framework generated by Qwen 3.6-Plus:

import pandas as pd
import numpy as np
from statsmodels.tsa.arima.model import ARIMA
import matplotlib.pyplot as plt

# Read data
df = pd.read_sql(query, connection)
df['month'] = pd.to_datetime(df['month'])
df = df.sort_values('month')

# Calculate month-over-month growth
df['mom_change'] = df['sales'].pct_change() * 100

# ARIMA prediction
model = ARIMA(df['sales'], order=(1, 1, 1))
results = model.fit()
forecast = results.forecast(steps=1)

# Output results
print(f"Next month predicted sales: {forecast.values[0]:.0f} (10K)")
print(f"95% Confidence interval: {results.get_forecast().conf_int().iloc[0].values}")

This complex analysis that would normally take 30 minutes to 1 hour manually. In AskTable, you just need one sentence.

Text-to-JS: Frontend Visualization

When you need to generate interactive charts or dashboards, AskTable takes the Text-to-JS channel:

Generate an interactive bar chart from the above analysis results, with month filter support

AskTable will:

  1. Generate ECharts-based JavaScript code
  2. Configure interactive components and filters
  3. Render interactive visualization results

Three-channel design considerations:

  • Text-to-SQL: Best for precise query problems, directly answering "what is it"
  • Text-to-Python: Best for complex analysis problems, answering "why" and "what will happen"
  • Text-to-JS: Best for visualization display, answering "what it looks like"

AskTable automatically selects the most suitable channel for your question, but you can also specify manually.

Iterative Analysis

Data analysis rarely succeeds in one shot. You can continue asking based on results:

How much did electronics sales drop in March compared to February? What are the main reasons?

AskTable will:

  • Preserve analysis context (knows you're focusing on electronics)
  • Automatically associate relevant data (monthly comparison, category breakdown)
  • Generate attribution analysis report

For Canvas Agent collaborative analysis mode, see AskTable Canvas Agent Collaborative Analysis.


Step 3: Memory and Skills

This is the core capability that distinguishes AskTable from traditional BI tools - the Agent remembers you.

![AskTable Memory](/blogs/qwen-3-6-asktable-claude-code-ai-data-workflow/5.jpeg

Memory System: Knows You Better Over Time

AskTable's Agent has persistent memory capabilities, remembering:

  • Your analysis preferences: Prefer bar charts or line charts? Focus on sales or profit margin?
  • Business context: Which department are you responsible for? Which metrics do you follow?
  • Historical analysis paths: What angle do you usually approach problems from?
  • Custom metrics: Compound metrics and calculation logic you've defined
  • Common data sources: Which tables and fields do you query most often?

For example, if you've previously said "I care more about profit margin than absolute sales," next time you ask:

How are each product line performing?

AskTable will prioritize sorting by profit margin, not sales. Because it remembers your preference.

Another example: if you've previously analyzed "East China sales anomaly," the next time you mention "East China," the Agent will proactively associate with previous analysis context:

How is East China performing this month?

AskTable will:

  • Automatically retrieve East China's anomaly analysis results from last month
  • Compare with this month's data to determine if anomaly persists
  • If anomaly has cleared, report improvement
  • If anomaly continues, further analyze change trends

Three-Layer Memory Architecture

AskTable's memory system has three layers:

Layer 1: Session Memory

  • Context information in current conversation
  • Includes time ranges, dimensions, metrics you've mentioned
  • Automatically cleared after conversation ends

Layer 2: User Memory

  • Long-term storage of your personal preferences and habits
  • Includes your commonly used data sources, analysis dimensions, visualization preferences
  • Persists across sessions

Layer 3: Team Memory

  • Team-shared business knowledge and analysis assets
  • Includes business glossary, metric definitions, analysis templates
  • New members automatically inherit

This layered design ensures: short-term analysis doesn't lose context, long-term collaboration doesn't lose knowledge.

Skill System: On-Demand Activation of Professional Capabilities

AskTable's Skill system gives Agents professional analysis capabilities. Common built-in skills include:

Skill NamePurposeTrigger Method
Anomaly DetectionAuto-identify anomalies in dataNatural language or manual activation
Attribution AnalysisLocate root causes of metric changes"Analyze the reasons for me"
Trend PredictionPredict future trends based on historical data"Predict next month's data"
Comparative AnalysisMulti-dimensional comparative analysis"Compare A and B"
Funnel AnalysisUser behavior conversion analysis"Analyze the conversion funnel"

Manual skill activation method:

Activate anomaly detection skill and check if there are anomalies in March sales data

AskTable will:

  1. Load anomaly detection skill configuration
  2. Scan for anomaly points and patterns in data
  3. Mark anomalies and provide possible causes
  4. Generate anomaly detection report

Memory's Team Collaboration Value

In traditional BI tools, each analyst needs to understand the business from scratch and rebuild analysis frameworks. In AskTable:

  • When new employees join the team, the Agent has already accumulated business understanding
  • Senior analysts' thinking is remembered by the Agent, newcomers can directly follow
  • Team's collective wisdom is deposited as reusable analysis assets

This is precisely what we mean: not tool upgrade, but change in thinking style.


Step 4: Report Generation and Team Collaboration

Auto-Generate Structured Reports

When you complete a round of analysis, you can ask AskTable to generate a report:

Generate a complete report from the above analysis results

AskTable will automatically:

  1. Organize analysis process: Sort all steps and findings from this analysis
  2. Structure content: Arrange according to "Background → Data → Analysis → Conclusions → Suggestions" structure
  3. Insert visualizations: Embed charts and key data into report
  4. Add summary: Generate executive summary and key findings

Generated report format similar to:

# 📋 2026 March Sales Analysis Report

## Executive Summary
- March total sales 64.06M, MoM down 8.2%
- Apparel profit margin leads (30%), but sales MoM down 12%
- Electronics highest sales (23.4M), down 5.3%

## Detailed Analysis
...

## Key Findings
...

## Suggestions
...

Team Collaboration: Shared Agent Memory and Skills

AskTable's team collaboration capabilities at several levels:

Shared Agent Memory

  • Team members share the same Agent instance
  • One person's analysis context can be picked up by others
  • Business understanding and analysis preferences automatically inherited

Shared Skill Configuration

  • Team-customized skills visible to all members
  • New employees don't need to configure from scratch
  • Senior analysts' Skill configurations can be shared to team with one click

Collaborative Analysis Canvas

  • Multiple people collaborate on the same Canvas
  • Each person's analysis results sync in real-time
  • Support comments, annotations and discussions

For Canvas's detailed features, see AskTable Canvas Agent Collaborative Analysis.


IV. Advanced Usage

Custom Skills

In addition to built-in skills, you can create custom skills:

Help me create a "Competitor Price Monitoring" skill:
- Data source: competitor_prices table
- Monitoring metric: price changes exceeding 5%
- Output format: table + trend chart

AskTable will:

  1. Analyze your requirements and generate Skill configuration
  2. Define trigger conditions and execution logic
  3. Configure output format and notification method
  4. Save as reusable Skill

After creation, you can invoke anytime:

Activate competitor price monitoring and see if there were any price changes this week

Multi-Source Cross-Analysis

AskTable supports cross-datasource associative analysis:

Compare order data from the sales database with budget data in Excel, and see how each department's expense execution is performing

AskTable will:

  1. Automatically identify two datasources needing association
  2. Generate cross-database association query
  3. Calculate budget execution rate
  4. Mark departments over budget

Scheduled Analysis and Alerts

You can set scheduled tasks:

Every day at 9 AM, automatically check yesterday's sales data and notify me if there are anomalous fluctuations

AskTable will:

  1. Create scheduled task
  2. Execute analysis automatically daily
  3. Detect anomalies and generate summary
  4. Send notifications through your specified method

Deep Claude Code Integration

In Claude Code, you can not only invoke AskTable for data analysis, but also:

  • Let Claude Code explain analysis results: After AskTable returns data, have Claude Code interpret in business language
  • Let Claude Code generate analysis plans: Describe your analysis goals and let Claude Code plan analysis steps
  • Let Claude Code optimize queries: If analysis results are unsatisfactory, let Claude Code adjust query strategy

This "AI analysis + AI interpretation" dual-engine mode is impossible for traditional BI tools.


V. Cost Analysis

Token Consumption vs Traditional BI Labor Costs

Let's do the math.

Traditional BI Analysis Process:

StepLaborTimeCost (at 500 yuan/day)
Understanding requirementsBusiness analyst0.5 day250 yuan
Writing SQL to fetch dataData engineer1 day500 yuan
Data cleaningData engineer0.5 day250 yuan
Analysis modelingData analyst1 day500 yuan
Making chartsData analyst0.5 day250 yuan
Writing reportBusiness analyst1 day500 yuan
Total3 people4.5 days2,250 yuan

AI Analysis Process (Qwen 3.6-Plus + AskTable + Claude Code):

StepTimeToken ConsumptionCost (estimated)
Natural language requirements1 min~200 tokens~0.01 yuan
SQL generation + execution10 sec~500 tokens~0.03 yuan
Analysis modeling30 sec~1,000 tokens~0.05 yuan
Chart generation10 sec~300 tokens~0.02 yuan
Report generation30 sec~2,000 tokens~0.10 yuan
Total~2 min~4,000 tokens~0.21 yuan

Cost Comparison:

  • Traditional: ~2,250 yuan, 4.5 days, 3 people collaborating
  • AI: ~0.21 yuan, 2 minutes, 1 person completing
  • Cost reduction: ~10,000x
  • Time reduction: ~3,000x

Of course, this comparison is idealized. Actual use还需要考虑:

  • AskTable platform subscription cost
  • Claude Code subscription cost
  • Data infrastructure construction cost
  • Personnel learning cost

But undeniably, AI data analysis's marginal cost is extremely low. Once the workflow is built, the cost of each analysis is almost negligible.

ROI Thinking

What's more worth thinking about isn't the cost of single analysis, but the change in analysis frequency:

  • Under traditional methods, because costs are high, many analyses "aren't worth doing"
  • Under AI methods, analysis becomes cheap enough to do exploratory analysis anytime, anywhere
  • Increased analysis frequency means improved decision quality

This is the real value of AI data analysis workflow.

Long-term Cost Model

Let's estimate long-term costs with a more realistic scenario:

Scenario: A 50-person medium-sized team needs to complete ~100 data analysis tasks monthly

DimensionTraditional BIAI Workflow
Labor configuration3 data analysts + 1 data engineer1 business person (self-service)
Monthly labor cost~60,000 yuan~15,000 yuan
Tool cost~5,000 yuan (BI license)~3,000 yuan (AskTable + Claude Code)
Model cost-~500 yuan (Token consumption)
Analysis output~80 times/month (labor bottleneck)~300+ times/month (on-demand)
Average response time1-3 days2-5 minutes
Monthly total cost~65,000 yuan~18,500 yuan

AI workflow not only reduces cost by over 70%, but more importantly analysis frequency increased by nearly 4x. This means more questions can receive timely data support, and decision quality will improve accordingly.


VI. Frequently Asked Questions

Q1: How to ensure data security?

  • AskTable supports row-level permission control, different roles see different data ranges
  • Database connections can use read-only accounts to prevent data modification
  • Sensitive fields can configure desensitization rules
  • All analysis operations have audit logs

Q2: How to manage when team scales up?

  • Use AskTable's team management features to set roles and permissions
  • Create independent workspaces for different departments
  • Unify team's analysis standards through Skill templates
  • Regularly review Agent memory to ensure knowledge base quality

Summary

The reason Qwen 3.6-Plus + AskTable + Claude Code is powerful isn't because individual components are amazing, but because:

  • Qwen 3.6-Plus provides the strongest domestic model programming and reasoning capabilities
  • AskTable provides complete data analysis infrastructure: connection, analysis, memory, collaboration
  • Claude Code provides the most natural interaction entry point: analyzing data by talking

The three combine to form a complete chain from data to insight.

AskTable Goal

cta.readyToSimplify

sidebar.noProgrammingNeededsidebar.startFreeTrial

cta.noCreditCard
cta.quickStart
cta.dbSupport