sidebar.joinCommunitysidebar.communicateWithUsers
sidebar.joinAskTableCommunity

sidebar.wechat

sidebar.feishu
sidebar.chooseYourWayToJoin
sidebar.contactUssidebar.getProfessionalSupport

sidebar.aliyunOfferConsultationsidebar.scanForAliyunOffer

sidebar.wechat
sidebar.feishu
sidebar.chooseYourWayToJoin
"Profit increased by ¥500,000 this month."
Boss asks: "What was the main reason?"
You answer: "Probably because sales increased, and costs also dropped a bit..."
The word "probably" is unacceptable in attribution analysis.
The essence of attribution analysis isn't listing "possible reasons," but quantifying exactly how much each factor contributed.
These numbers add up to ¥500,000. Every point of change is accounted for, no模糊的"maybe."
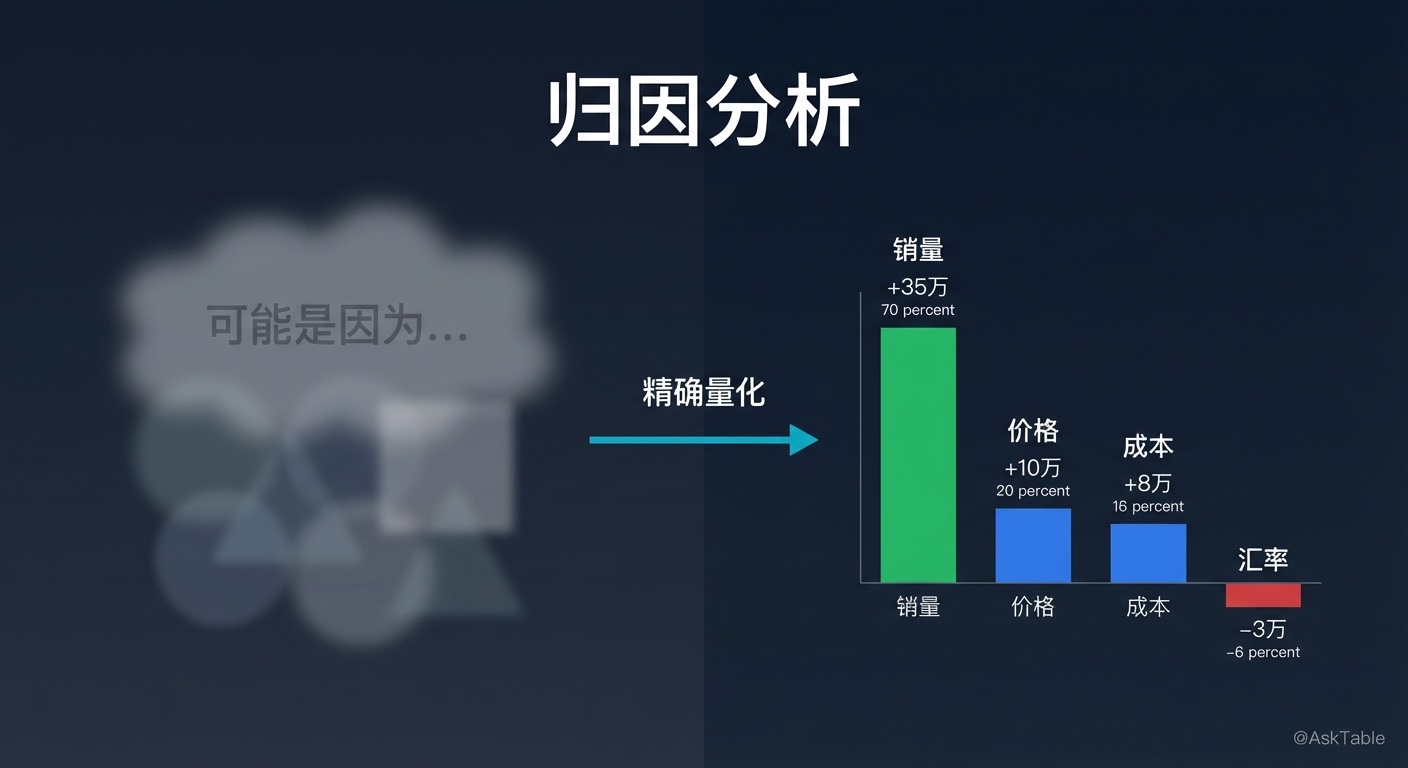
AskTable's attribution analysis skill does exactly this: turns "probably because of X" into precise contribution quantification.
Challenge 1: Multiple Factors Changing Simultaneously
Profit grew by ¥500,000 this month. At the same time:
- Sales volume increased 15%
- Product A prices increased 5%
- Raw material costs decreased 8%
- Shipping costs increased 12%
- New product launch brought additional revenue

Every factor is affecting the final result, and they interact with each other.
How do you decompose this?
Challenge 2: Interaction Effects Between Factors
Sales volume +15% + Price increase 5% ≠ Simple addition

Because price increases may have suppressed some demand - actual sales volume growth might have been 18% without the price increase.
Simple addition and subtraction can't handle this interaction effect.
Challenge 3: Internal and External Factors Mixed
Internal factors: pricing strategy, marketing campaigns, product adjustments
External factors: industry trends, competitor actions, policy changes, weather

Which can we control? Which is "good luck"?
Attribution needs to distinguish between these two types of influence.
AskTable's attribution analysis follows three levels:
Level 1: Factor Decomposition
  → Decompose result metrics into driving factors using mathematical formulas
  → Example: Revenue = Traffic × Conversion Rate × Avg Order Value

Level 2: Contribution Calculation
  → Calculate each factor's incremental contribution from base period to reporting period
  → Consider interaction effects, ensuring sum of factor contributions = total change

Level 3: Impact Classification
  → Distinguish internal controllable factors from external uncontrollable factors
  → Distinguish one-time factors from persistent factors
AskTable automatically decomposes composite metrics into quantifiable driving factors:
| Target Metric | Decomposition Formula | Driving Factors |
|---|---|---|
| Revenue | Traffic × Conversion Rate × AOV | Traffic change, conversion rate change, AOV change |
| Profit | Revenue - Cost | Revenue change, cost change (further decomposed) |
| Gross Margin | (Revenue - Cost) / Revenue | Price change, cost change, product mix change |
| Sales per Sq Ft | Sales / Area | Customer flow change, conversion rate change, AOV change |
AskTable uses the chain substitution method (also called factor analysis method) to ensure each factor's contribution can be precisely quantified:
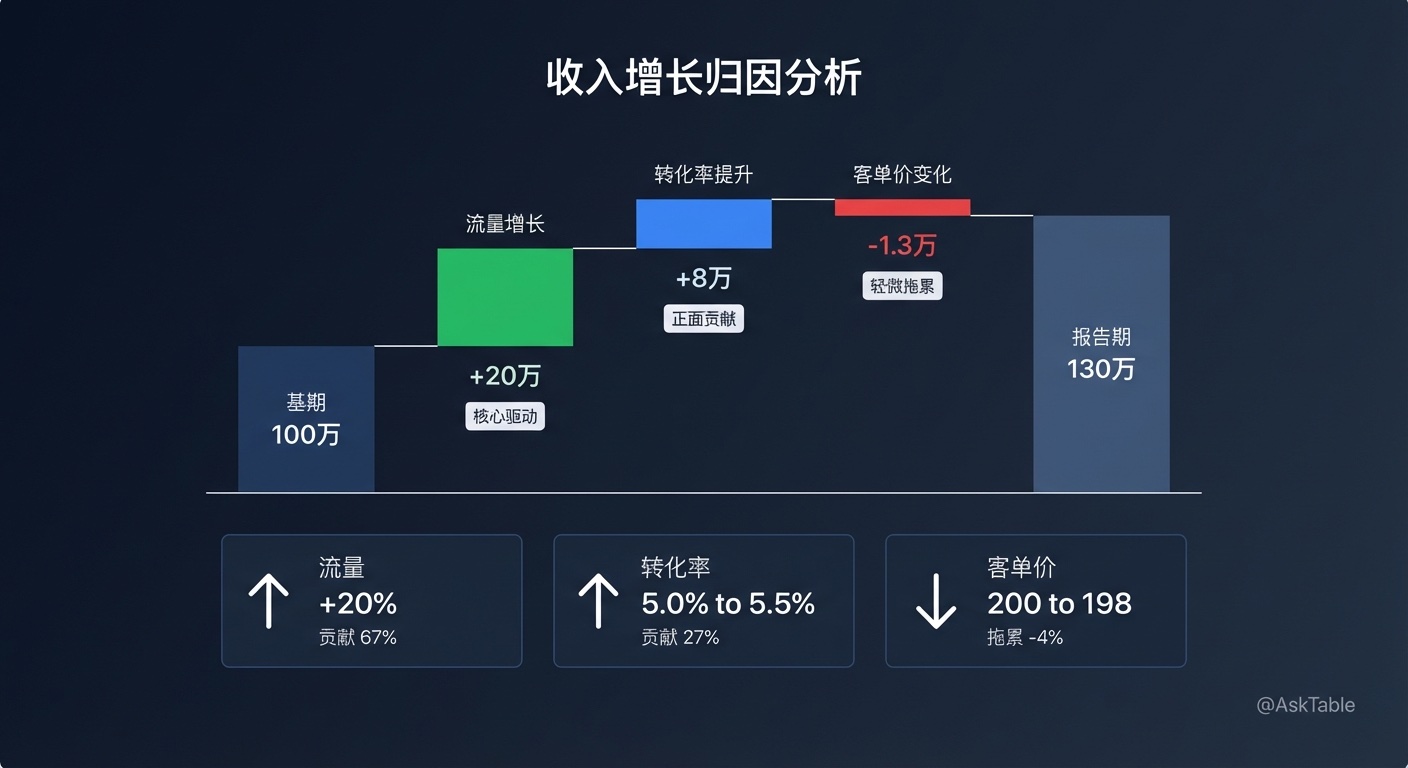
Example: Revenue increased from ¥1M to ¥1.3M (+¥300K)

Base period: 10,000 traffic × 5% conversion × ¥200 AOV = ¥1M
Reporting period: 12,000 traffic × 5.5% conversion × ¥198 AOV = ¥1.307M

Chain substitution:
1. Only traffic changes: 12,000 × 5% × ¥200 = ¥1.2M → Traffic contribution +¥200K (66.7%)
2. Traffic + conversion rate change: 12,000 × 5.5% × ¥200 = ¥1.32M → Conversion contribution +¥120K (40%)
3. All three factors change: 12,000 × 5.5% × ¥198 = ¥1.307M → AOV contribution -¥13K (-4.3%)

Total change: +200 + 120 - 13 = +¥307K (≈ ¥300K, difference from interaction term allocation)
Beyond contribution, AskTable also calculates each factor's elasticity coefficient:
Elasticity Coefficient = Factor Change % / Result Change %

Example:
- Traffic elasticity: Traffic increases 20%, revenue increases 30% → Elasticity 0.67
  (Every 1% traffic increase = 0.67% revenue increase)
- Conversion rate elasticity: Conversion increases 10%, revenue increases 30% → Elasticity 3.0
  (Every 1% conversion increase = 3% revenue increase)

Conclusion: Conversion rate is the most sensitive lever, with the best ROI.
AskTable actively distinguishes which are internal controllable factors and which are external uncontrollable factors:
| Factor | Type | Meaning |
|---|---|---|
| 5% price increase | Internal controllable | Active decision, can be adjusted |
| Marketing campaign driving traffic growth | Internal controllable | ROI can be optimized |
| Industry overall growth 8% | External uncontrollable | "Rising tide lifts all boats," not own capability |
| Weather impacting customer traffic decline | External occasional | One-time interference, shouldn't be counted as trend |
User Question: "Revenue grew ¥300K this month - where did it come from?"
📊 Revenue Attribution Analysis

Total revenue change: +¥300K (+30%)

Driving factor contributions:
1. Traffic growth: +¥200K (67%) ✅ Core driver
   - Organic search traffic +25%
   - Paid advertising traffic +15%
2. Conversion rate improvement: +¥80K (27%) ✅ Positive contribution
   - Improved from 5.0% to 5.5%
   - Mainly from mobile conversion optimization
3. AOV change: -¥13K (-4%) ⚠️ Slight drag
   - Decreased from ¥200 to ¥198
   - Mainly affected by promotional discounts

External factor estimation:
- Industry overall growth about 8%, contributing approx +¥55K
- Organic growth (excluding industry factors): +¥245K (82%)

Conclusion: Revenue growth mainly from traffic expansion, secondarily from conversion optimization.
But AOV declined slightly - need to watch promotional impact on profitability.
User Question: "Profit increased - was it from selling more or from cost reduction?"
📊 Profit Attribution Analysis

Total profit change: +¥500K (+25%)

Decomposition:
1. Revenue side contribution: +¥650K (130%)
   - Volume growth: +¥450K
   - Price adjustment: +¥200K
2. Cost side contribution: -¥150K (-30%)
   - Raw material price increase: -¥220K
   - Efficiency improvement: +¥70K

Conclusion: Profit growth 100% from revenue side, cost side actually dragged.
Raw material price increases offset part of profit growth - need to watch supply chain optimization.
User Question: "How much incremental business did this promotion bring? How much would have been bought anyway?"
📊 Promotion Attribution Analysis

Total sales during promotion: ¥2.8M
Normal daily average sales: ¥150K × 7 days = ¥1.05M
Total increment: +¥1.75M

Increment decomposition:
1. Pre-purchasing (would have bought in future anyway): -¥400K
   - Consumers purchased early, pulling forward future demand
2. New demand (true increment): +¥1.6M
   - New customers from campaign: +¥850K
   - Existing customer extra purchases: +¥750K
3. AOV increase: +¥550K
   - Promotion drove AOV from ¥200 to ¥245

Campaign ROI:
- Campaign investment: ¥300K
- True increment (excluding pre-purchasing): ¥1.6M + ¥550K = ¥2.15M
- ROI = 2.15M / 300K = 7.2
"Profit increased this month - which factor contributed the most?"
"Did revenue growth come from price increases or volume increases?"
"What was the true increment from this marketing campaign?"
"Help me decompose the reasons for gross margin change"
"Decompose revenue change by price and volume factors"
"Decompose the reasons for profit margin decline"
"Explain the reasons for profit changes in language my boss can understand"
AskTable first performs attribution analysis, then generates interpretations in business language, so non-data personnel can understand.
Anomaly Detection (discovers profit anomaly)
    ↓
Comparative Analysis (compared with last month/last year, how much difference)
    ↓
Attribution Analysis (quantify each factor's contribution) ← Core
    ↓
Metric Interpretation (translate into business language)
    ↓
Report Orchestration (output complete attribution report)
Attribution analysis is the most critical link in the diagnostic chain - it answers "why."
Pain Point: Monthly profit fluctuated significantly, but management couldn't explain the reasons. Every operational analysis meeting, each department had their own opinion - sales said costs rose, procurement said prices dropped, no one could give quantified attribution.
Solution: Deploy attribution analysis skill, automatically generate monthly profit change attribution reports.
Results:
"Before, every department claimed credit at meetings. Now with the attribution report, the numbers are right there - who contributed how much is crystal clear. The discussion focus shifted from 'who's right' to 'how to improve.'" — CFO, A Manufacturing Company
The core value of the attribution analysis skill isn't "listing possible reasons," but:
Good attribution analysis doesn't find excuses for changes - it provides a basis for decisions.
sidebar.noProgrammingNeeded
sidebar.startFreeTrial
