sidebar.joinCommunitysidebar.communicateWithUsers
sidebar.joinAskTableCommunity

sidebar.wechat

sidebar.feishu
sidebar.chooseYourWayToJoin
sidebar.contactUssidebar.getProfessionalSupport

sidebar.aliyunOfferConsultationsidebar.scanForAliyunOffer

sidebar.wechat
sidebar.feishu
sidebar.chooseYourWayToJoin
If you've worked in business operations at an enterprise, you've likely experienced this scenario:
This scenario plays out every day in 90% of large and medium enterprises.
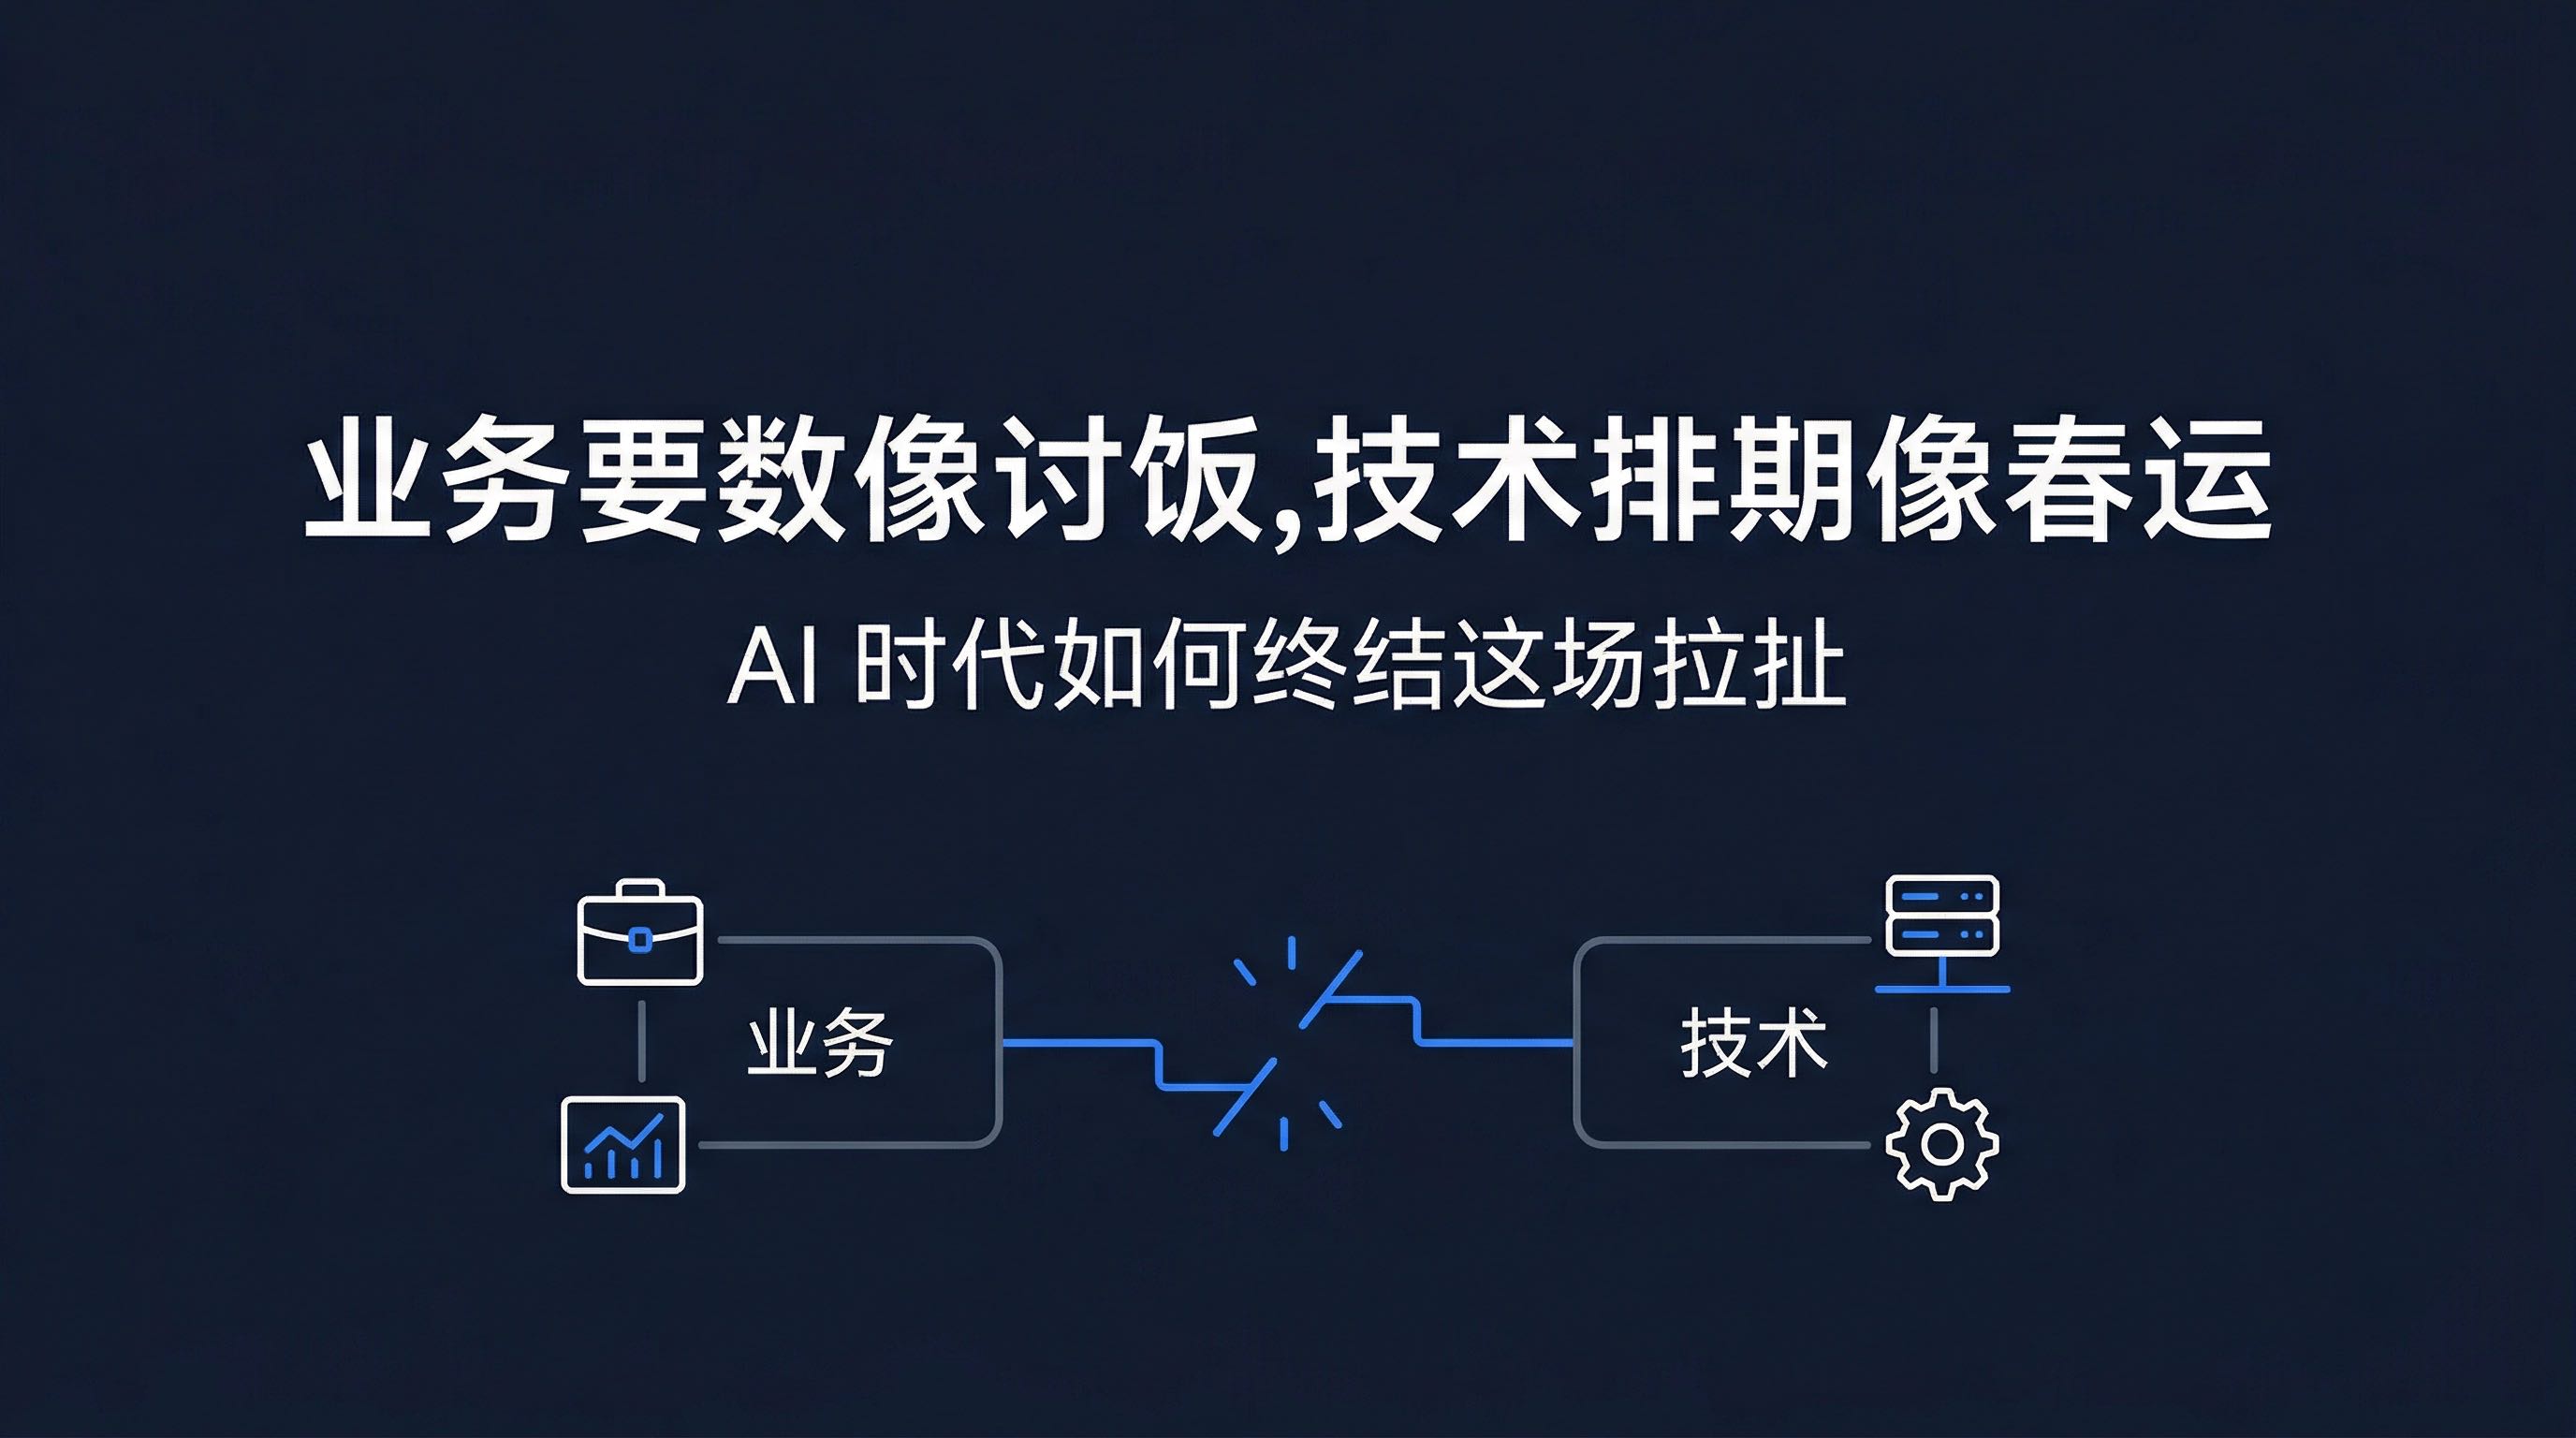
Today, I want to dive deep into a problem everyone has complained about but few have truly solved: the endless tug-of-war between business and tech departments around "data requests."
And why AskTable solves this with an approach so simple it's almost "counterintuitive"—Tech prepares 3-10 base tables, business queries freely.
Let's walk through the complete process of a "data request" from submission to delivery:
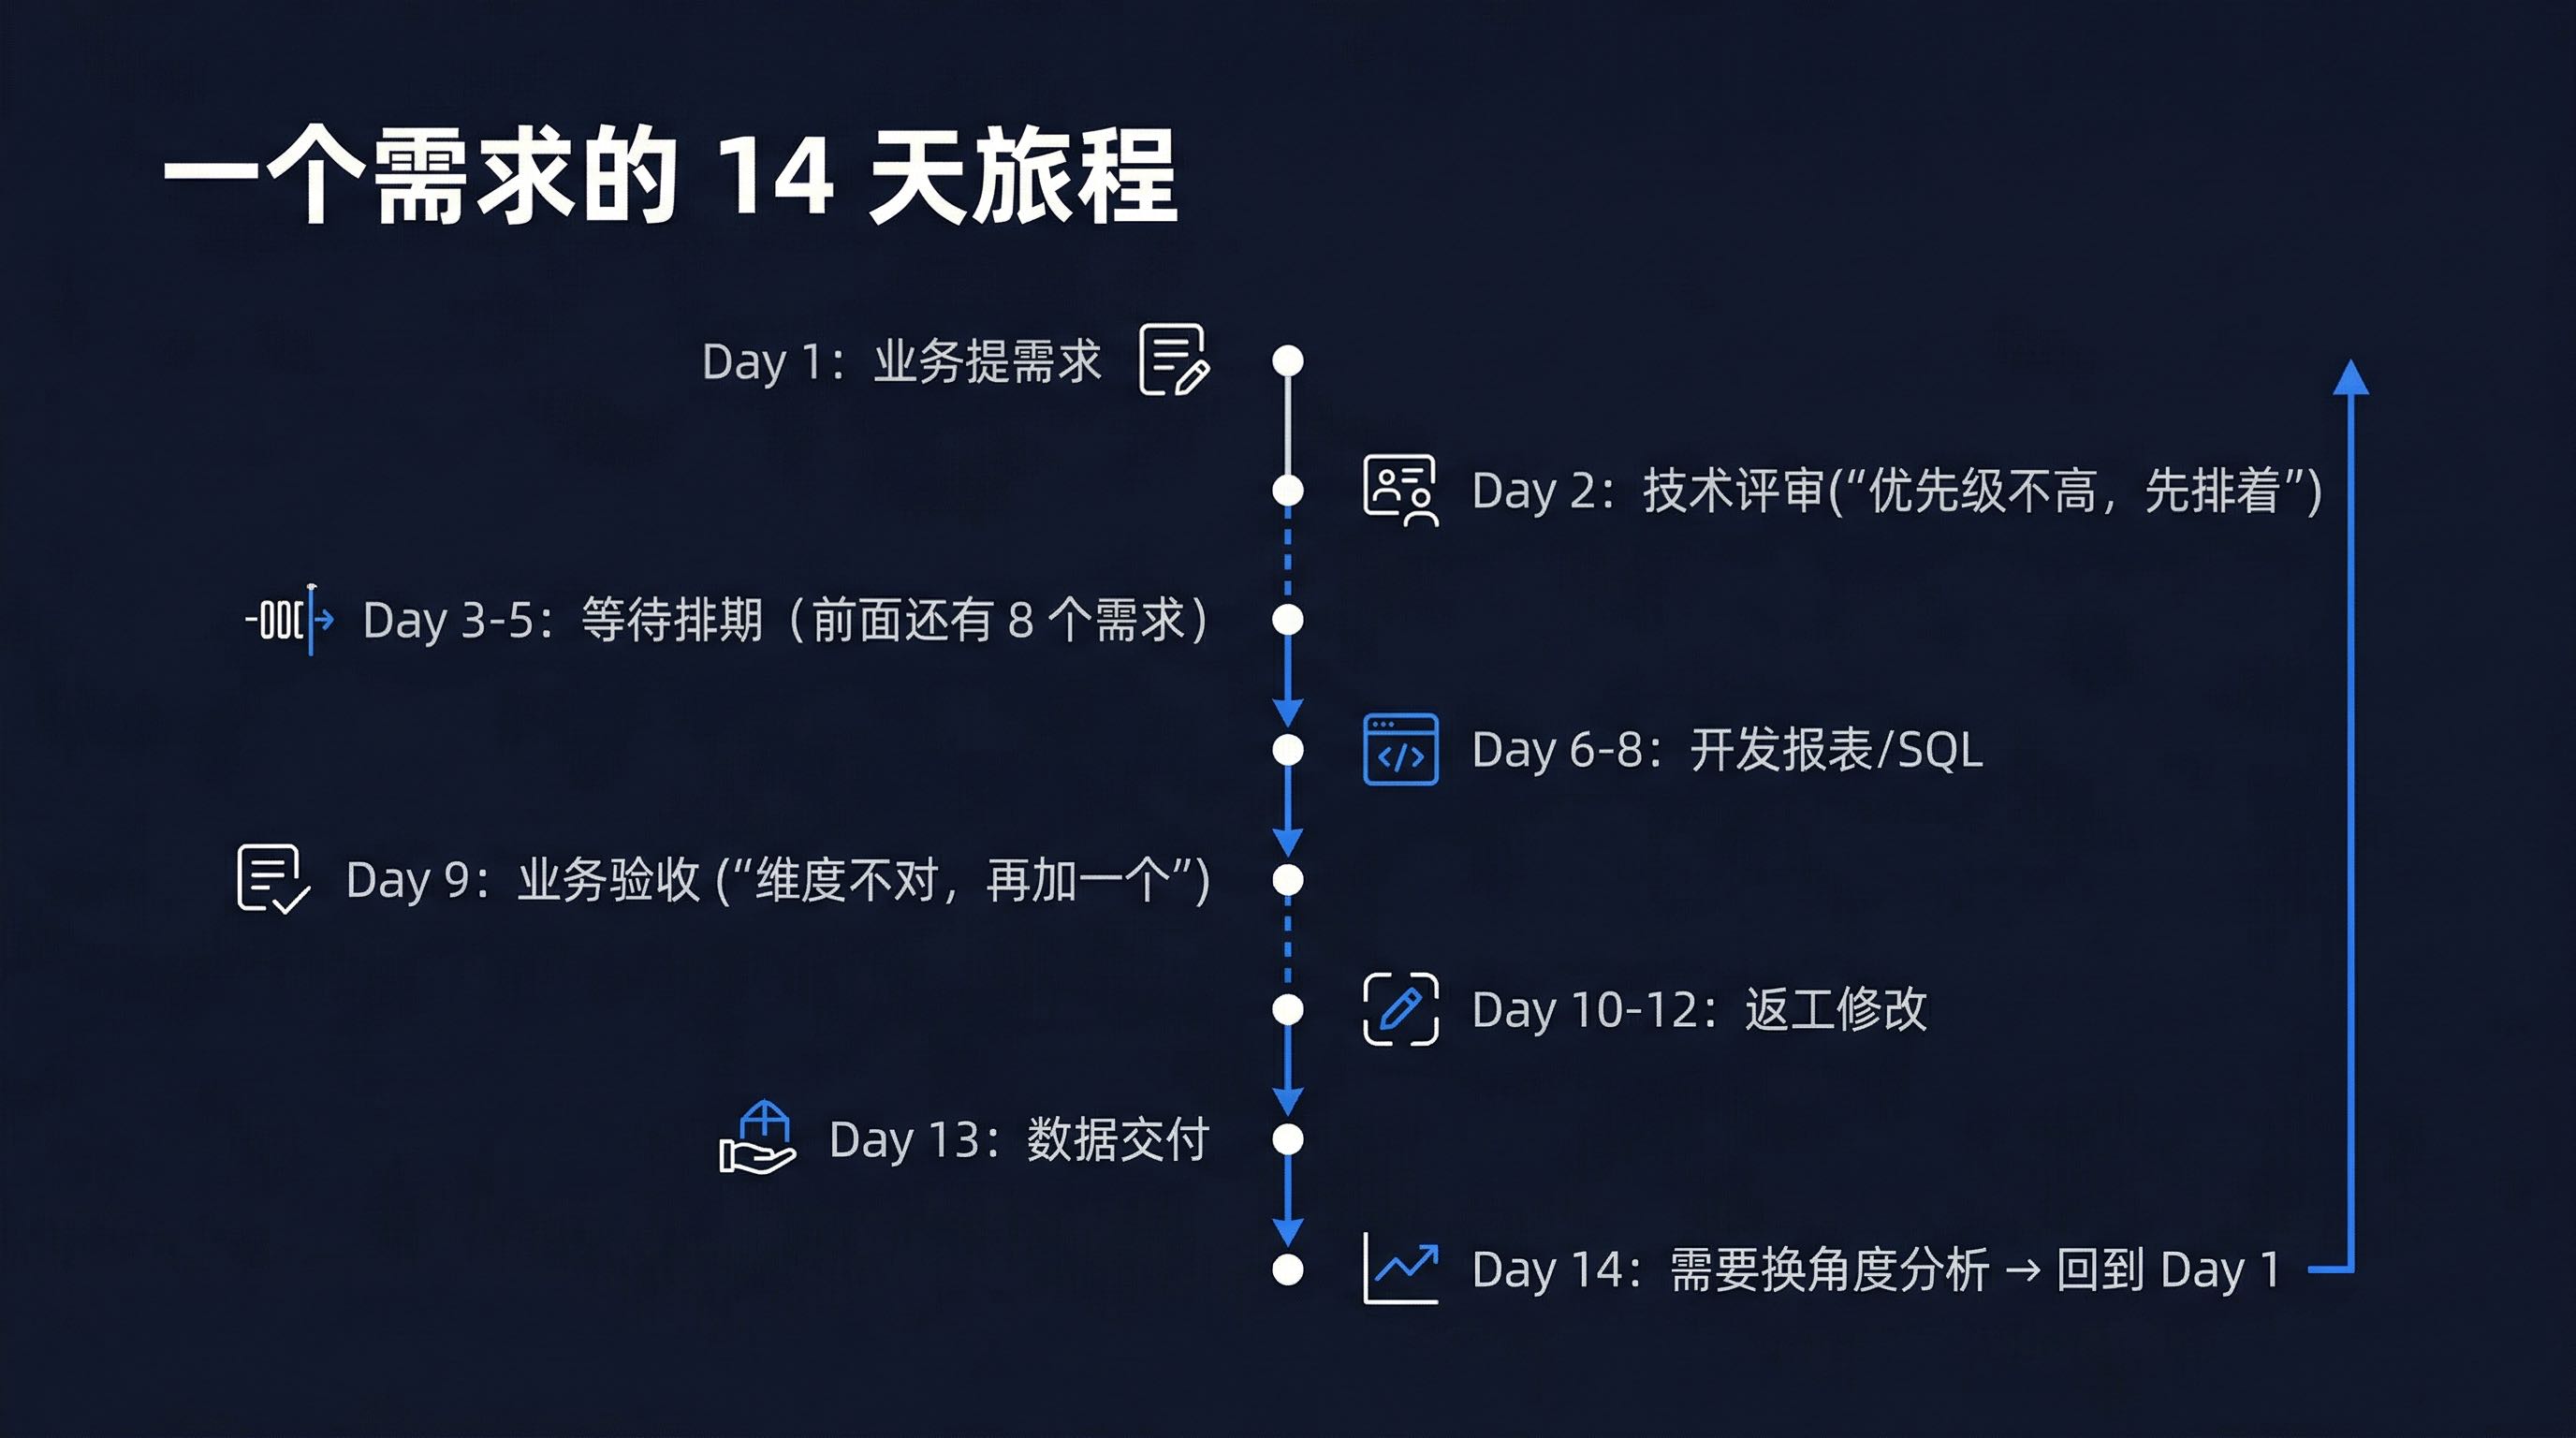
Day 1: Business submits request
  ↓
Day 2: Tech review ("This request has low priority, let's schedule it")
  ↓
Day 3-5: Waiting for scheduling ("8 requests ahead are in progress")
  ↓
Day 6-8: Developing report/SQL
  ↓
Day 9: Business acceptance ("Wrong, missing dimensions, add one more")
  ↓
Day 10-12: Rework
  ↓
Day 13: Data delivery
  ↓
Day 14: Business realizes they need a different angle analysis → Start from Day 1 again
Two weeks from request to data is the norm. During peak periods, personnel changes, or system upgrades, a month is not unusual.
Assume a medium-sized enterprise (500-1000 employees) with 200 data requests per month:
| Phase | Time | Labor | Monthly Cost (at 800/day) |
|---|---|---|---|
| Business submission, communication | 0.5 day/request × 200 | Business staff | 80,000 yuan |
| Tech evaluation, scheduling, waiting | 5 days/request × 200 | Time cost | (Hidden cost of decision delay) |
| Developing report/SQL | 1 day/request × 200 | Data engineer | 160,000 yuan |
| Rework (30% probability) | 2 days/request × 60 | Data engineer | 96,000 yuan |
| Total | 336,000 yuan/month |
This is only the explicit labor cost. More terrifying is the hidden cost of decision delay—
When you wait two weeks for data, the market window may have already closed.
In actual enterprise operations, there's an even more hidden but impactful problem:
Data analysis resources and capabilities are often concentrated in the hands of a few—usually department heads or executives.
The reasons are simple:
The result: The frontline staff who need data most for decisions are furthest from it. Because they can't outqueue the leader's "strategic analysis needs."
This creates a paradox: Those who need data most for frontline decisions have the least access to it.
When business complains "tech is too slow" and tech complains "business requirements keep changing," both perspectives are valid:
Business department's grievance:
Tech department's helplessness:
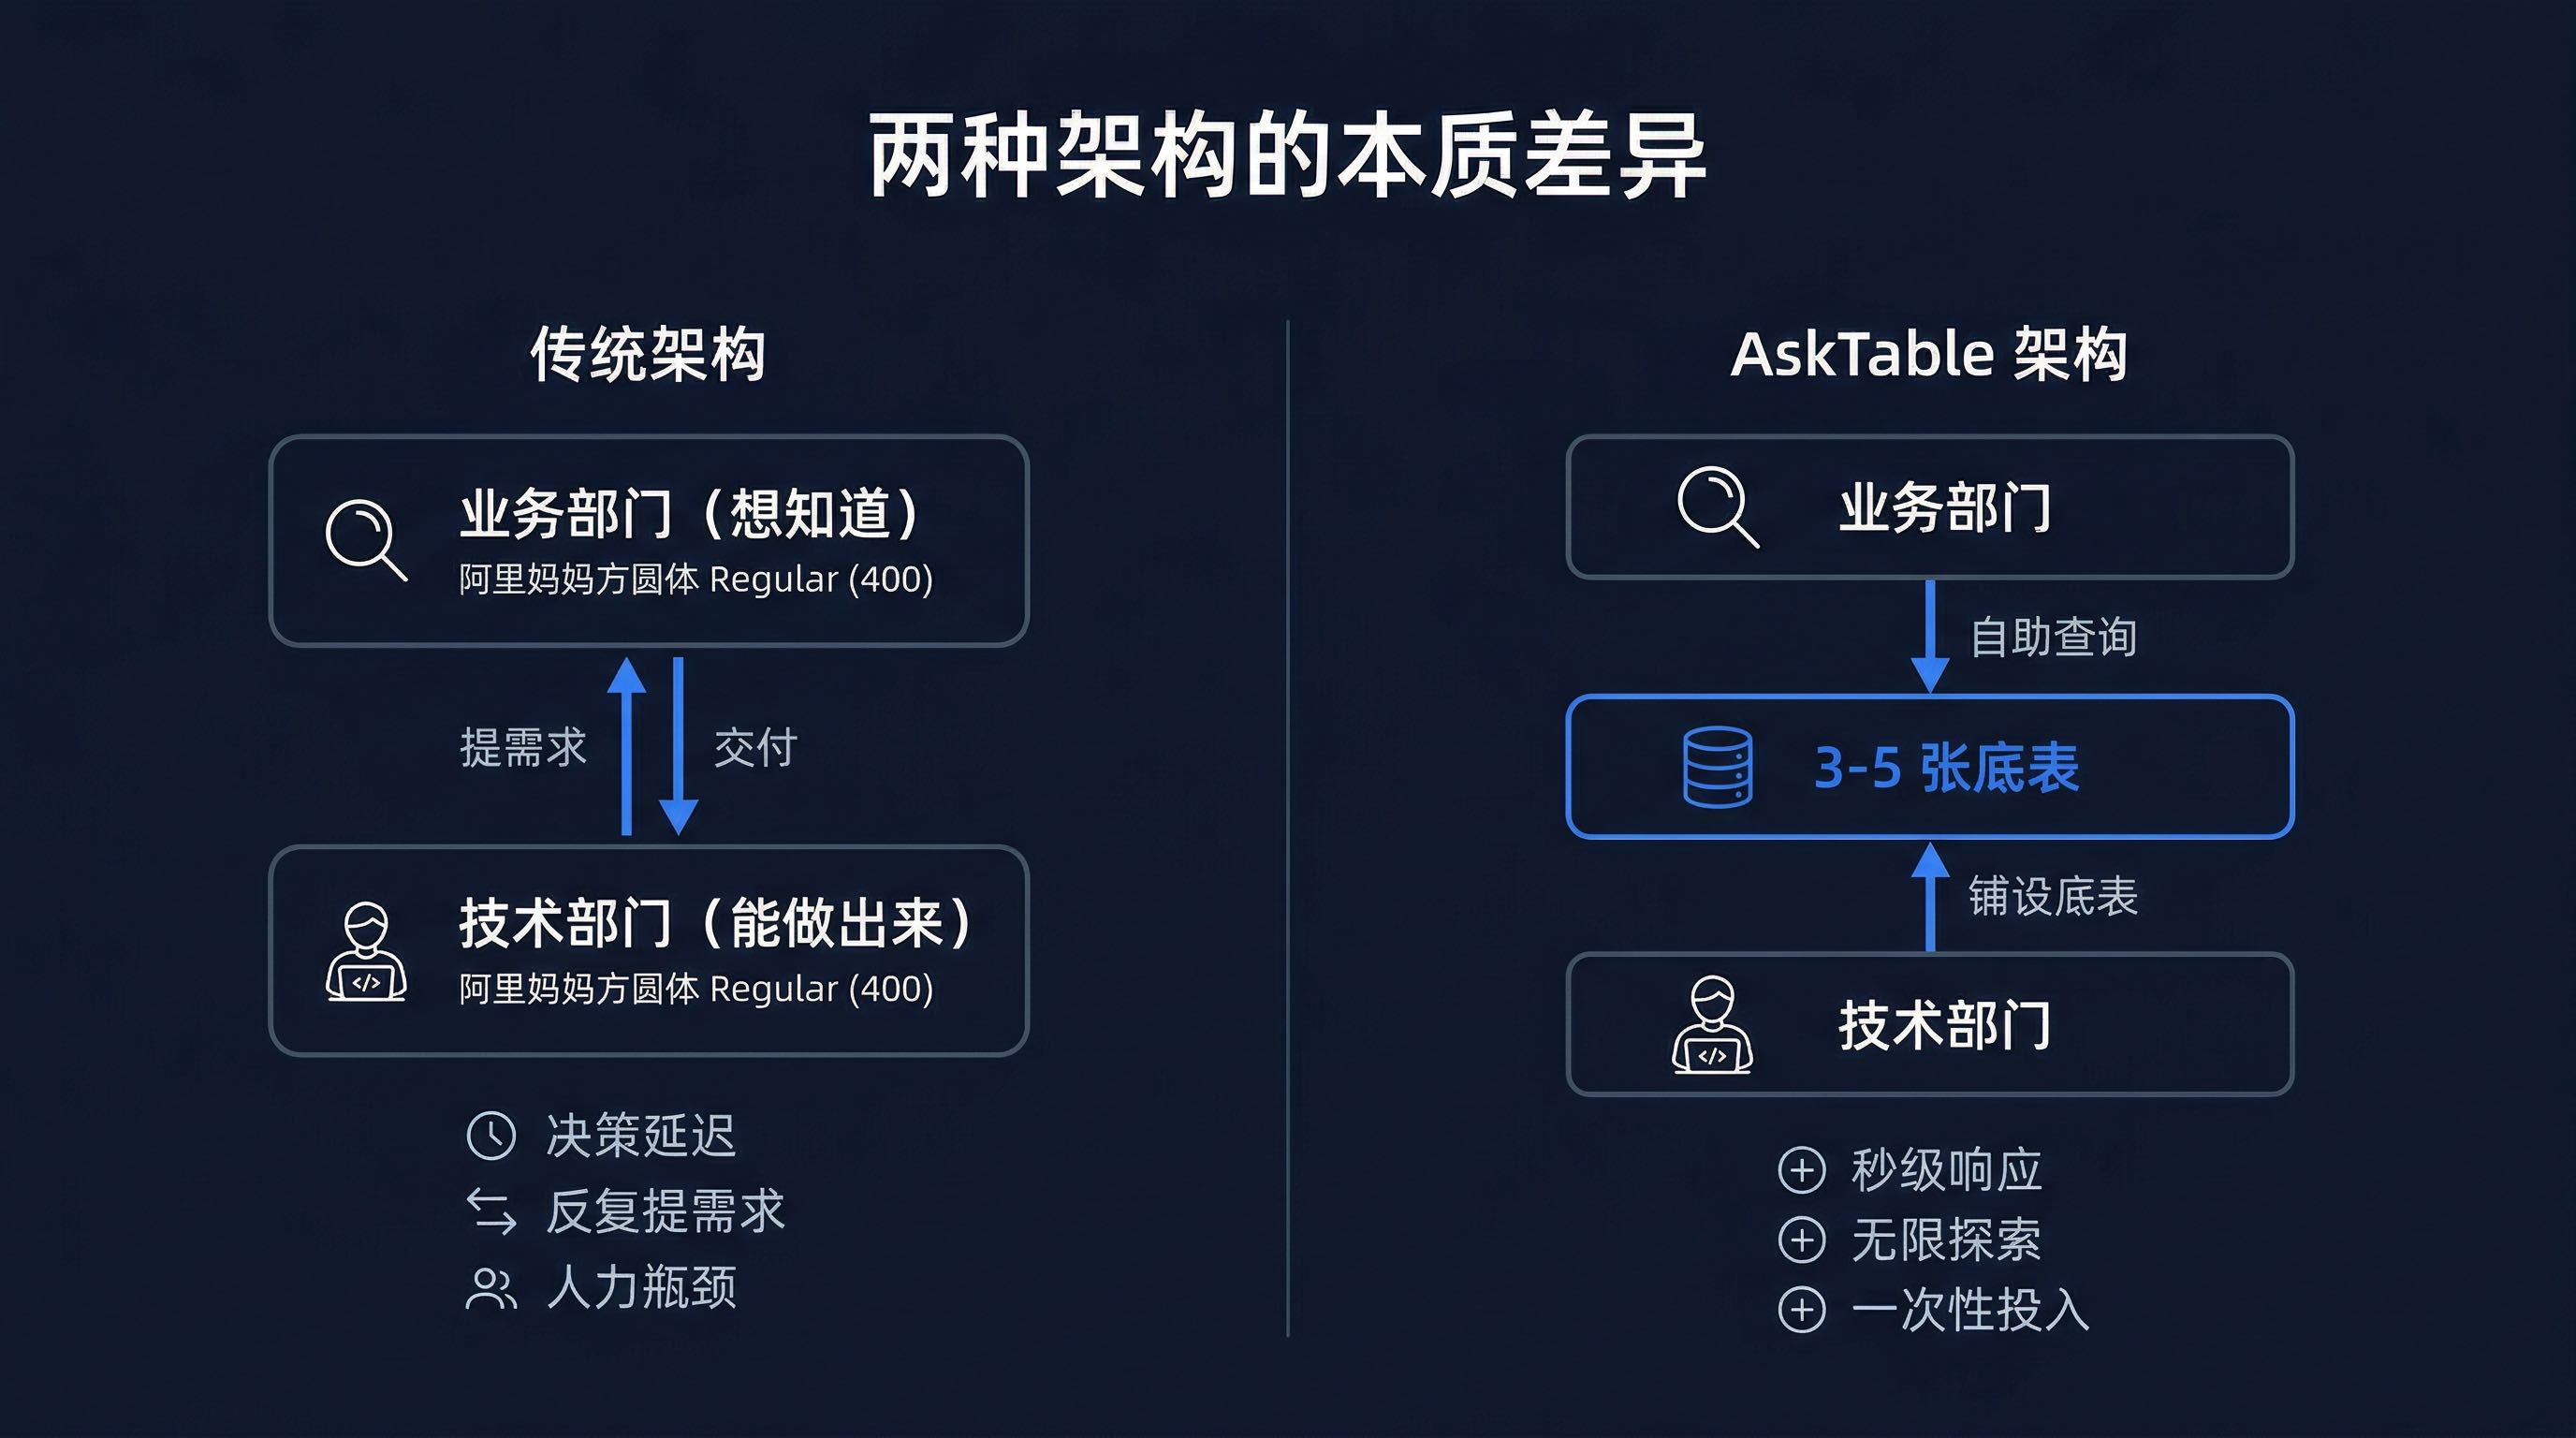
Neither side is wrong. The middle transmission architecture is wrong.
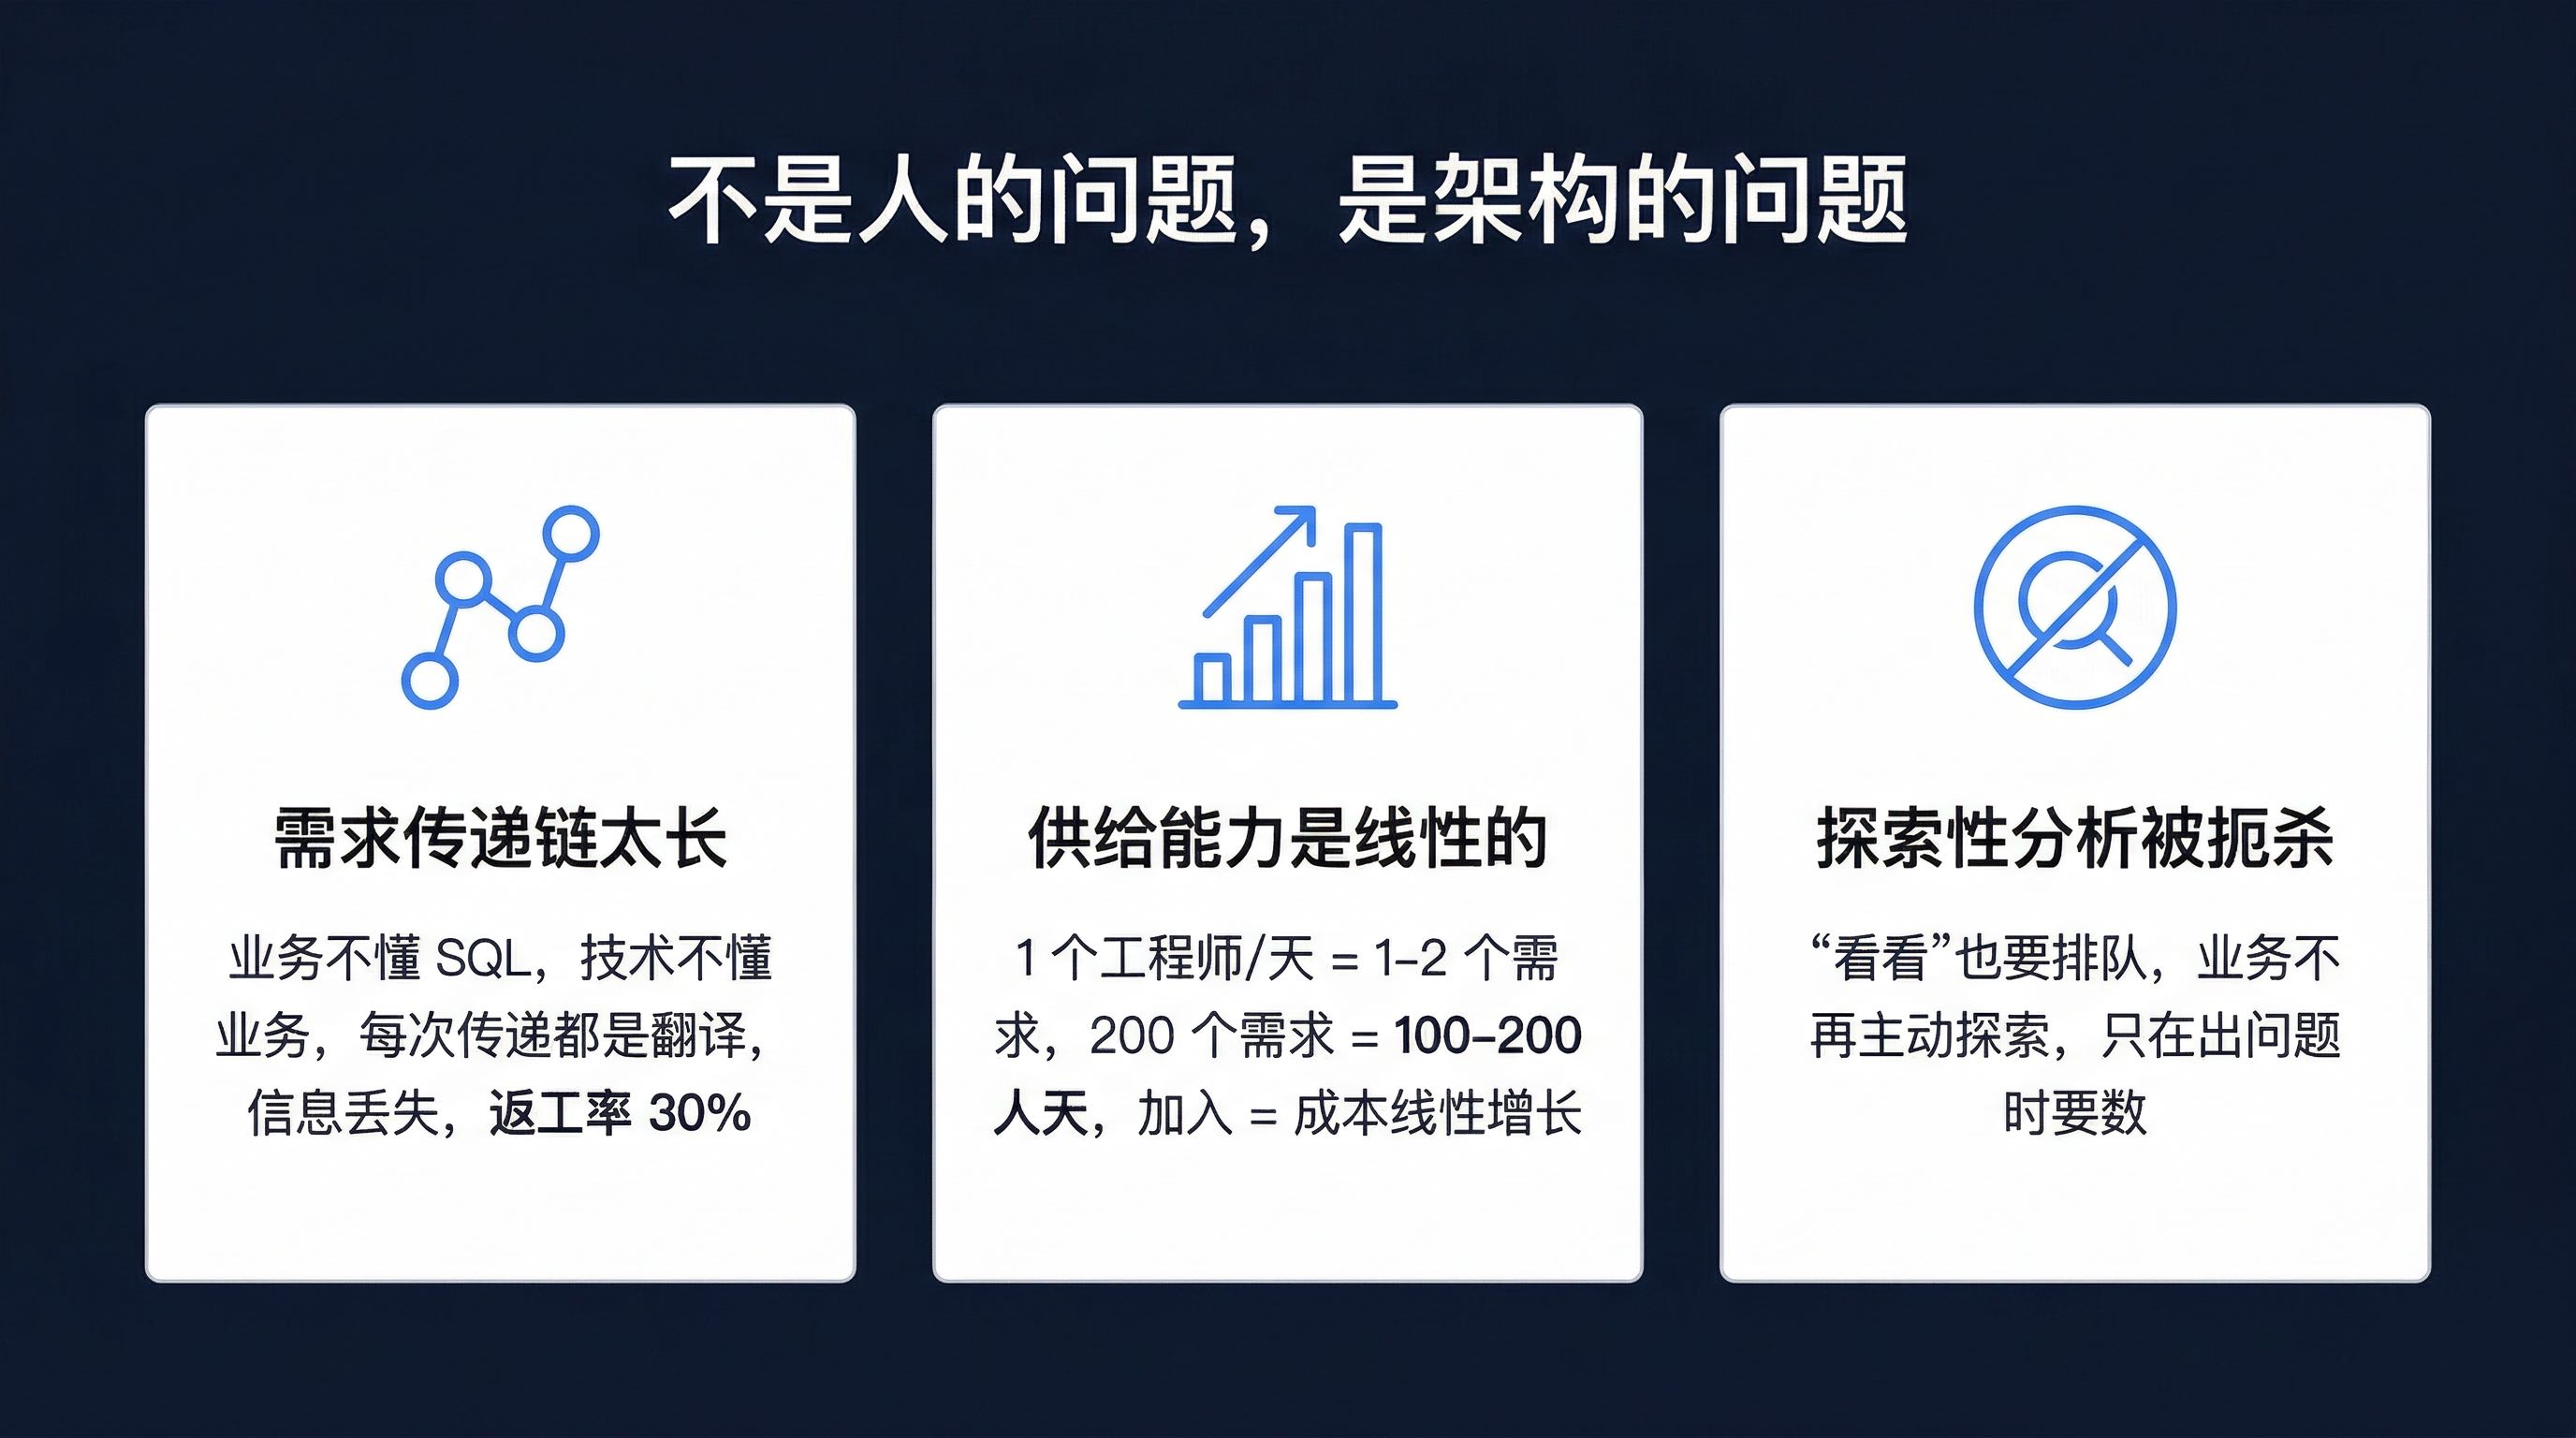
This architecture has three fatal problems:
First: Too long demand transmission chain.
Business doesn't understand SQL, tech doesn't understand business. Every demand transfer is a "translation," and translations lose information. Result: 30% rework rate.
Second: Supply capacity is linear.
One data engineer can handle 1-2 requests per day. 200 requests need 100-200 person-days. Adding people means linear cost growth, and new hires need time to get up to speed.
Third: Exploratory analysis is completely strangled.
If business has curiosity like "I just want to take a look," it's not allowed under traditional architecture—because "taking a look" is also a request, also needs to queue. Over time, business staff stop proactively exploring data, only remembering data when major problems arise.
This isn't data analysis; it's data charity.
AskTable's approach to this problem is so simple it's almost "counterintuitive":
Tech doesn't need to build 200 reports for business. Tech only needs to prepare 3-10 base tables for business. The rest, let business query freely.
Base tables are not reports, not dashboards, not fixed statistical results.
Base tables are structured, clean data foundation layers with sufficient dimensions. Similar to "wide tables" or "data marts" in data warehouses, but with finer granularity and more comprehensive dimensions.
Example:
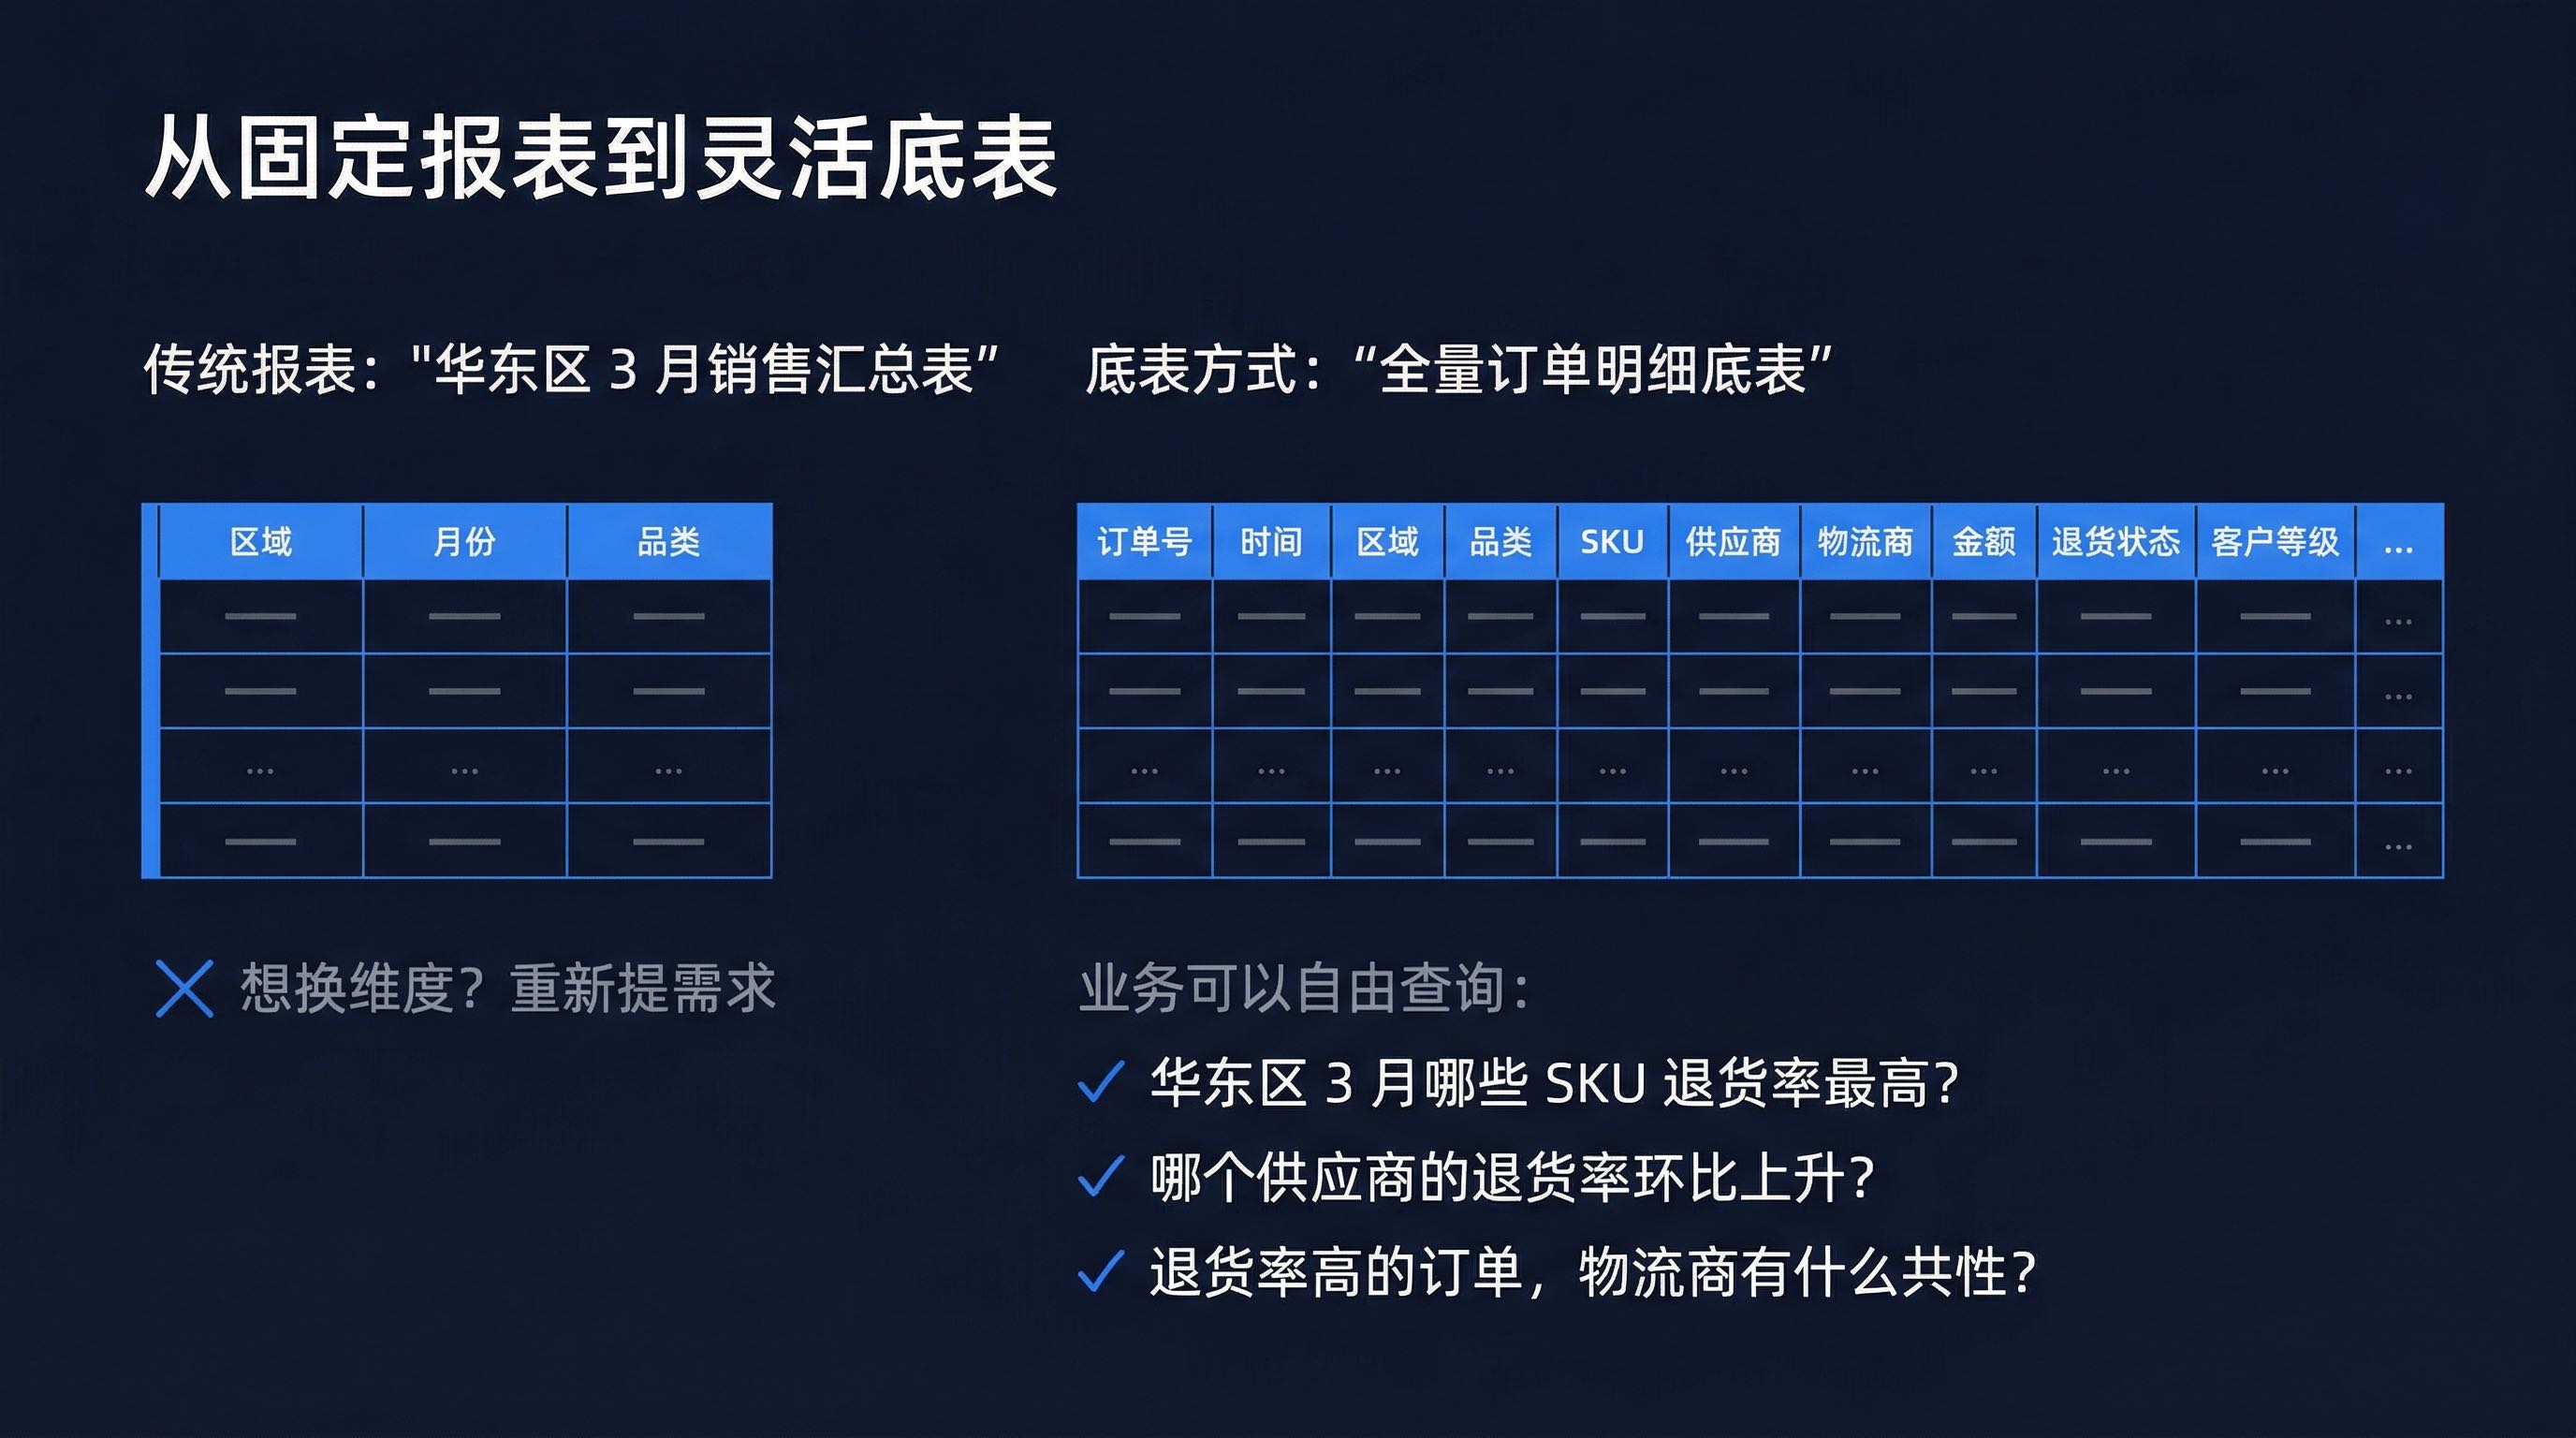
❌ Report (Traditional):
"East China March Sales Summary"
—— Fixed dimensions: region, month, category
—— Want to see "breakdown by supplier"? Submit new request.

✓ Base table (AskTable approach):
"Full Order Detail Base Table"
—— Contains fields: order number, time, region, category, SKU,
   supplier, logistics provider, amount, return status, customer tier...
—— Business queries freely:
   "Which SKUs had the highest return rate in East China in March?"
   "Which supplier's return rate increased week-over-week?"
   "What do return rate high orders have in common across logistics providers?"
Tech's work shifts from "endless report making" to "building good base tables":
Tech team responsibilities:
│
├── 1. Identify core data entities needed for business
│   └── Usually 3-5 tables, generally no more than 10
│
├── 2. Ensure base table data quality
│   └── Complete fields, unified metrics, timely updates
│
├── 3. Configure data sources in AskTable
│   └── Connect database, sync metadata, configure row-level permissions
│
└── 4. Teach business staff to ask questions in natural language
    └── Usually 30 minutes of training to get started
One-time tech investment,换来 business department's unlimited self-service queries.
Business's work shifts from "submitting requests and waiting for data" to "querying and analyzing themselves":
Business staff daily routine:
│
├── Query whatever they want, directly ask
│   └── "What were the top 10 SKUs by return rate in East China last month?"
│
├── Deepen analysis by continuing to ask
│   └── "What do these SKUs' suppliers have in common?"
│   └── "Break it down by logistics provider."
│
├── Do comparative analysis
│   └── "Compare return rate trends between these two suppliers."
│
└── Generate reports
    └── "Generate a report from the above analysis for my afternoon meeting."
No SQL writing, no waiting for tech scheduling, no repeated metric alignment.
Traditional architecture:
┌──────────┐     Submit request      ┌──────────┐
│ Business │ ──────────────────────→ │   Tech   │
│  (wait)  │                        │   (do)   │
└──────────┘                        └──────────┘
                                  ↓
                          Schedule → Develop → Deliver
                          Cycle: 1-2 weeks

AskTable architecture:
┌──────────┐                        ┌──────────┐
│ Business │ ←── 3-5 base tables ──→ │   Tech   │
│ (query)  │                        │ (build)  │
│           │                        └──────────┘
│ Query freely                      One-time investment
│ Instant response
│ Unlimited exploration
└──────────┘
"Let business query their own data"—this idea isn't new. But why didn't it work for over a decade, yet AskTable makes it work?
Attempt One: BI Self-Service Tools
Various BI tools (FanRuan, QuickBI) claim "self-service analysis," but actual usage barriers remain high:
Attempt Two: Fixed Reports + Dashboards
Build common reports, put them on dashboards. Problem:
Attempt Three: Teach Business SQL
Some enterprises try training business staff to write SQL. Result:
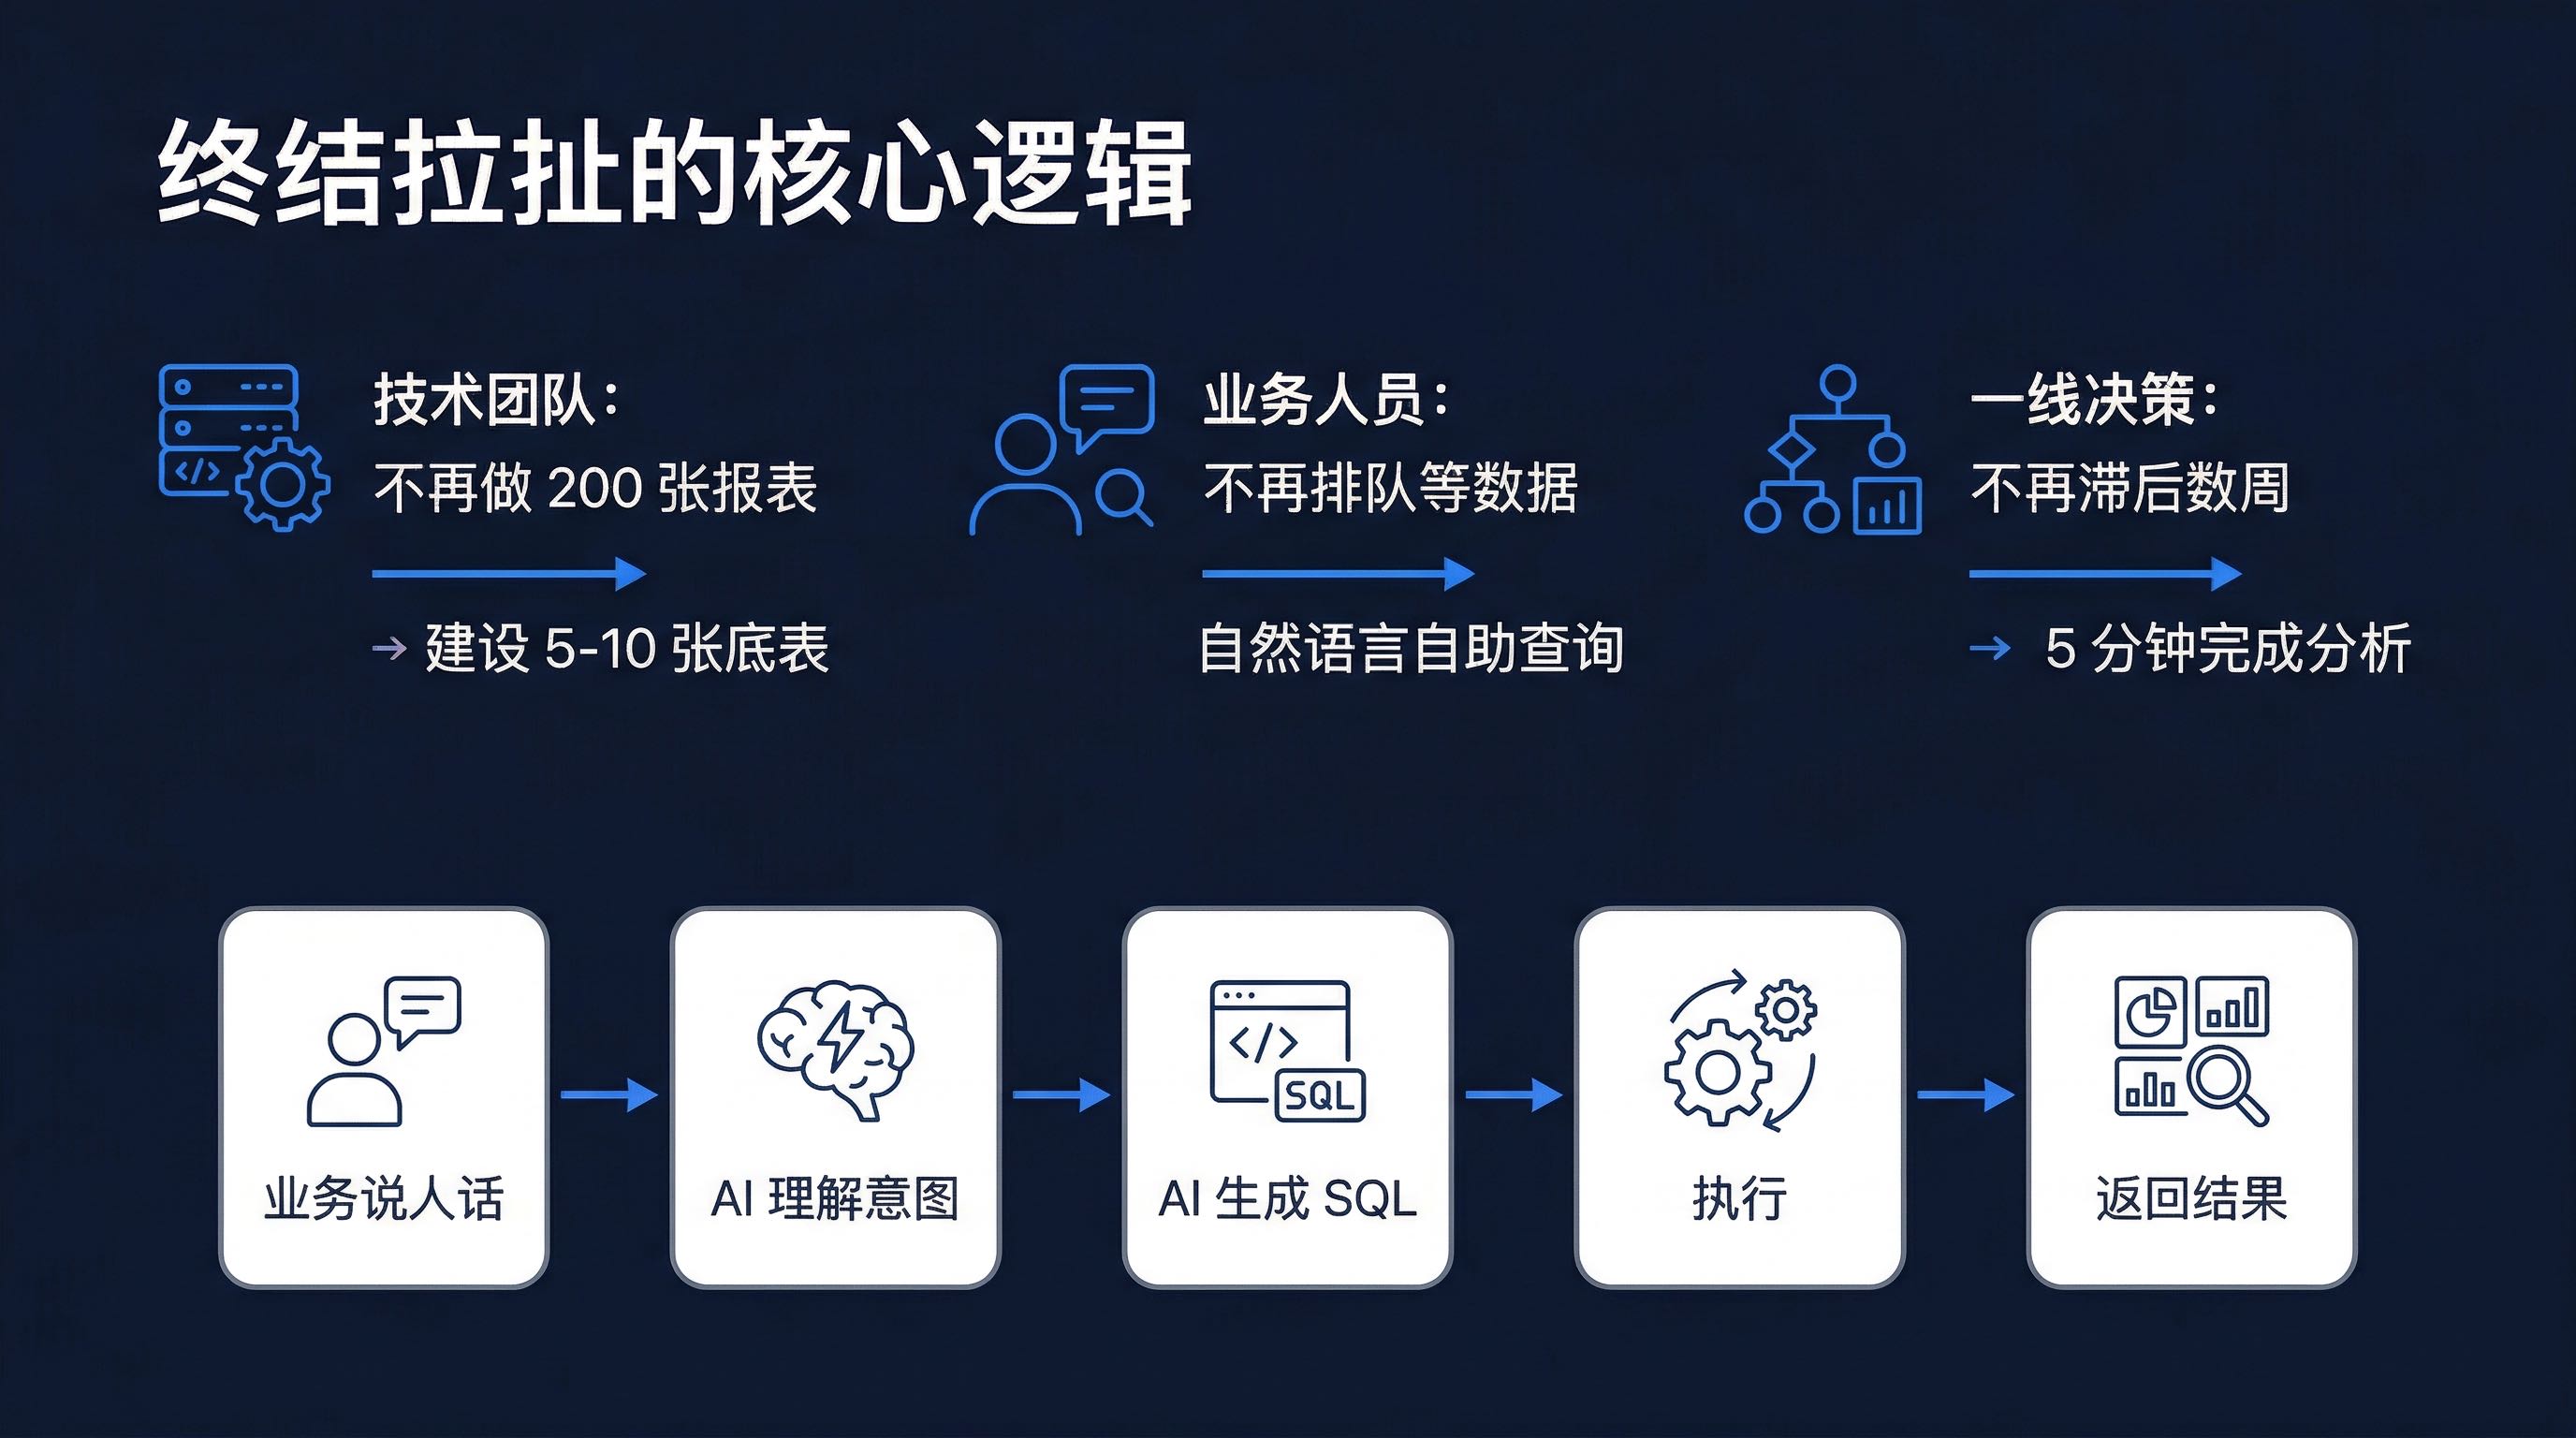
AskTable's core breakthrough: Using AI as the translation layer.
Business speaks human language → AI understands intent → AI generates SQL/Python → Execute → Return results
This relies on several key capabilities:
1. Text-to-SQL Maturation
Two years of LLM progress have increased natural language-to-SQL accuracy from under 60% to over 85%. AskTable's built-in SQL generation, combined with support for 20+ database types, covers most enterprise data scenarios.
2. Intelligent Metadata Annotation
After AskTable connects to a data source, it automatically scans table structures, field information, and generates Chinese business tags based on field names and data samples. Business doesn't need to know the underlying table is called t_order_detail_v3; they just say "order data."
3. Permission and Security Safeguards
4. Anomaly Detection and Attribution Analysis
AskTable doesn't just execute queries—it proactively discovers problems:
This is something traditional BI tools can't do—traditional tools only answer questions you ask, AskTable also tells you problems you haven't noticed.
For AskTable's AI Agent architecture design and built-in skill system, we have dedicated articles for in-depth analysis.
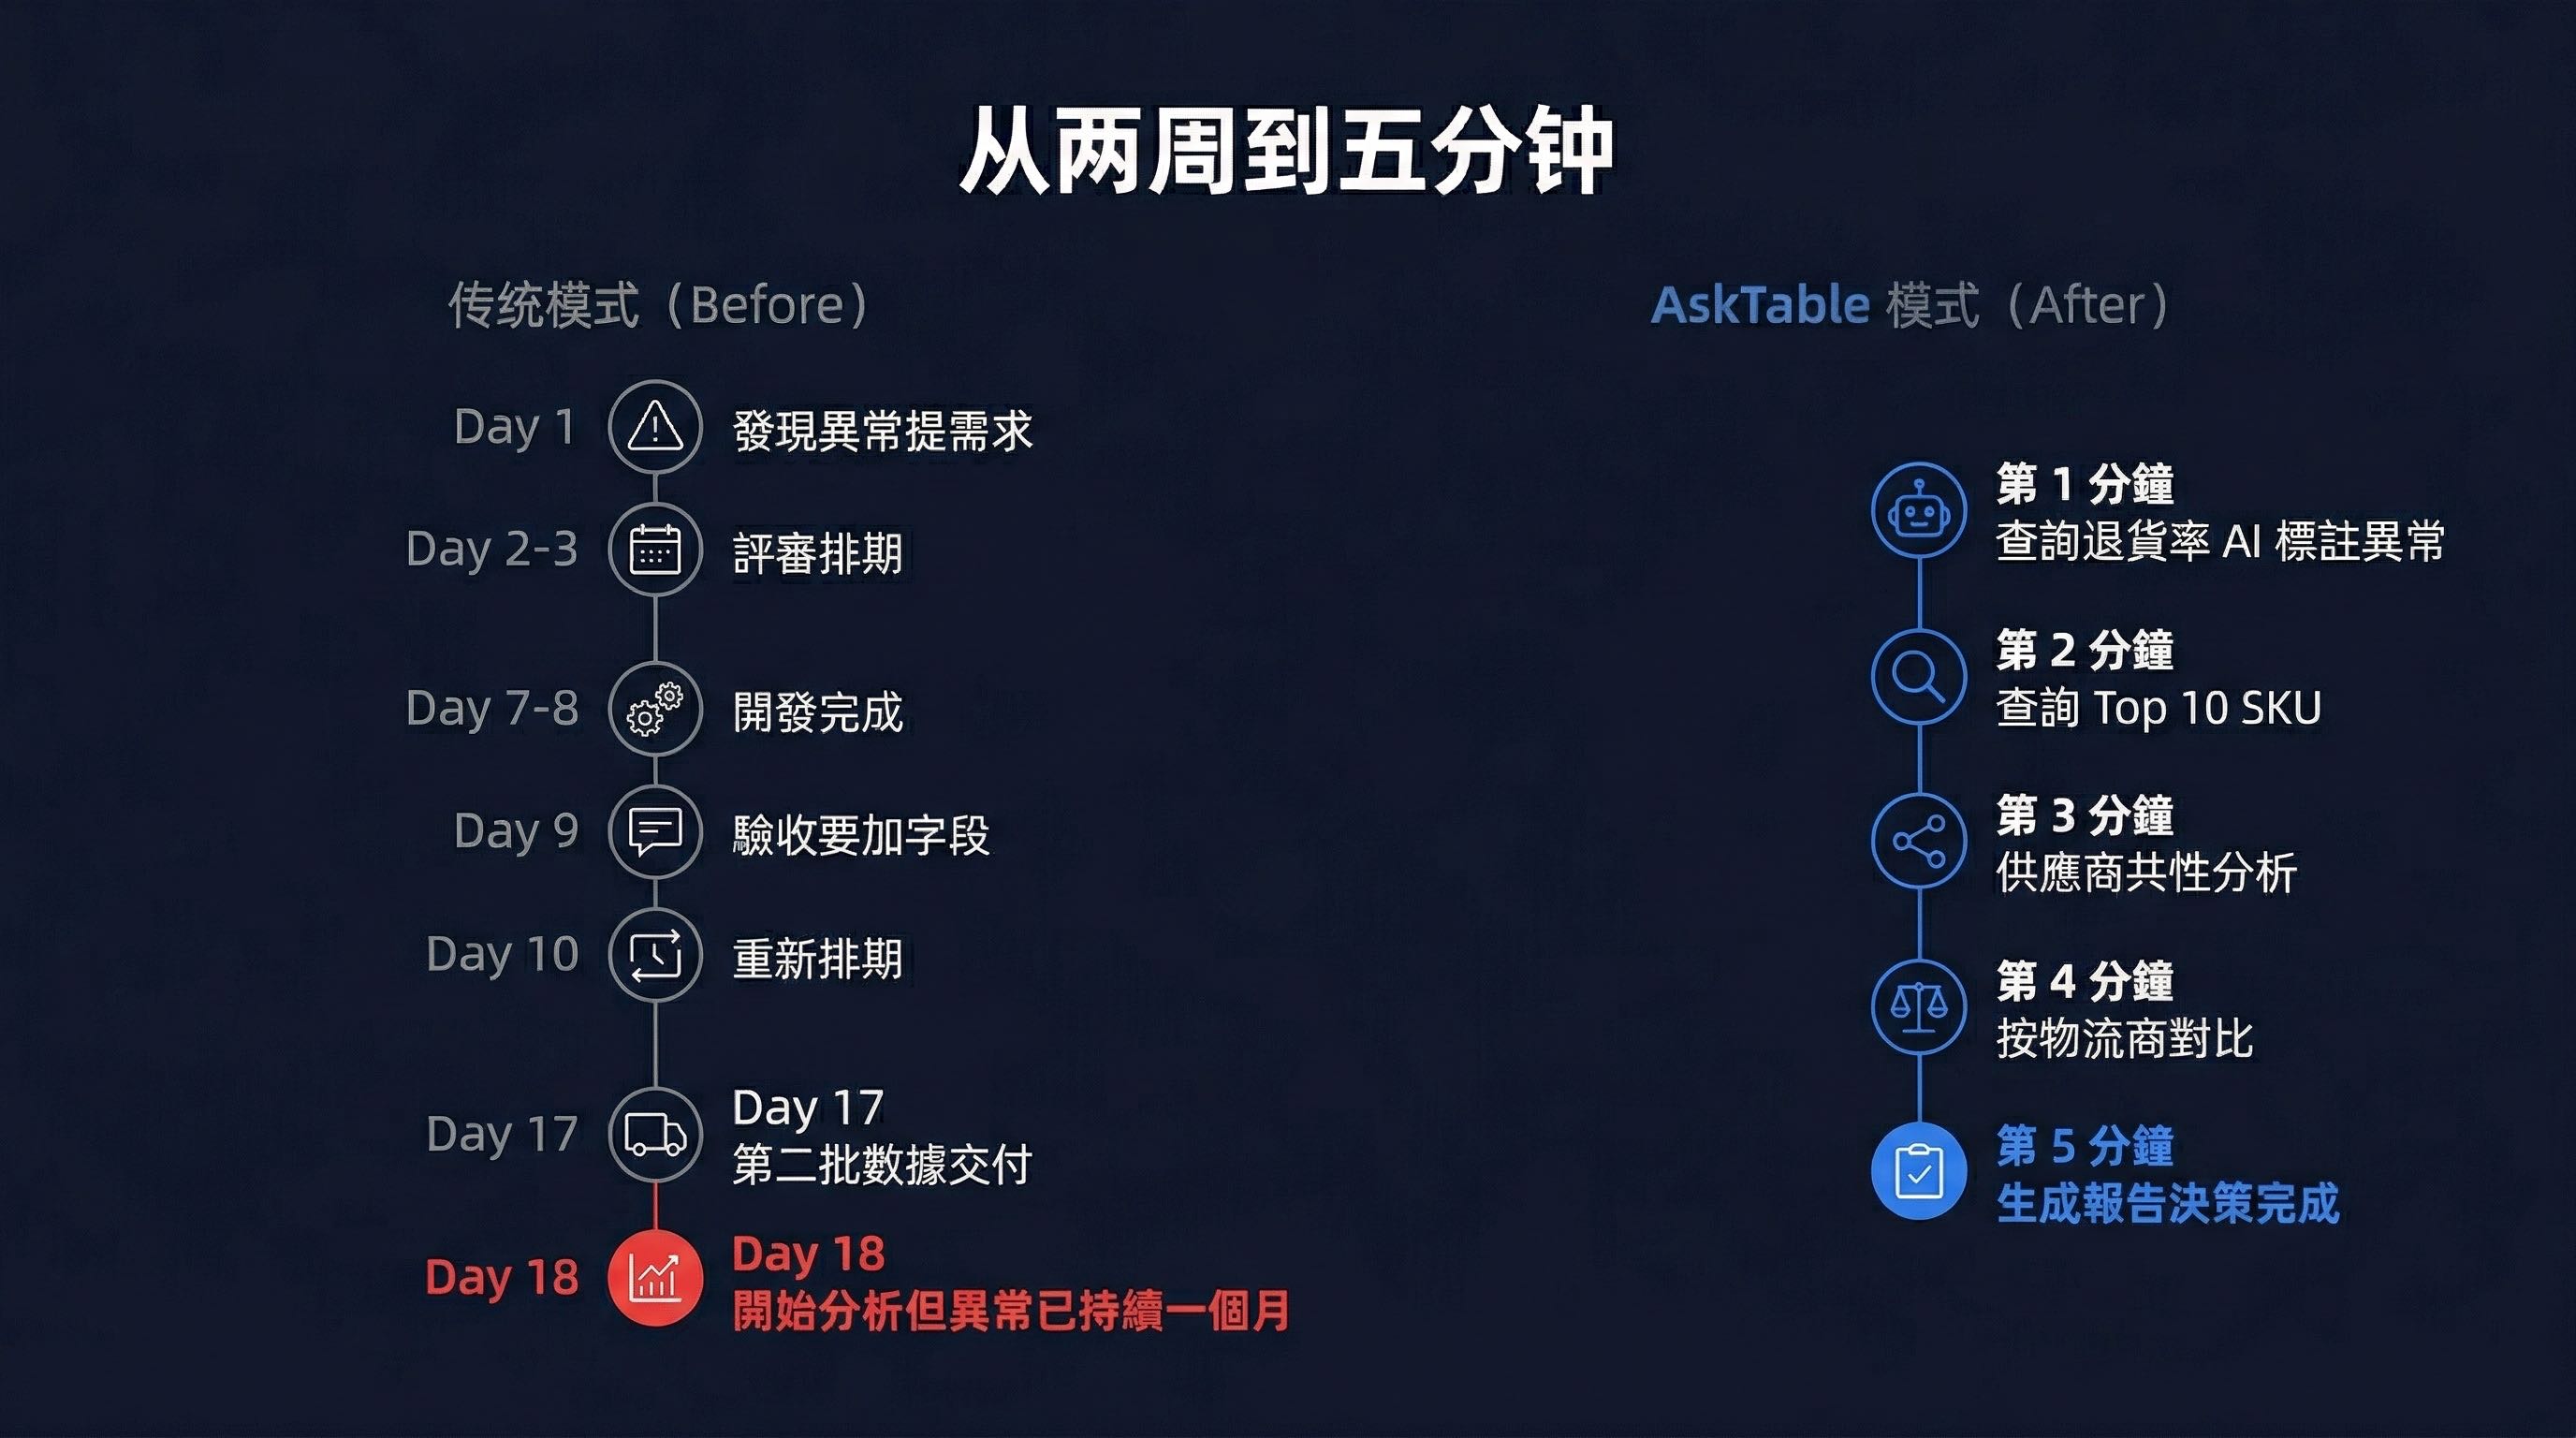
Before: Traditional Model (Two Weeks)
Day 1 - Business discovers anomaly, submits request:
  "Please pull East China SKUs return details for past 30 days,
   broken down by supplier and logistics provider."

Day 2-3 - Tech review and scheduling:
  "This request has medium priority, estimated processing next week."

Day 7-8 - Development complete:
  "Report is ready, please review."

Day 9 - Business acceptance:
  "Got the data. But I also want to trace by batch number,
   to see if it's a certain batch's quality issue."

Day 10 - Tech response:
  "This requires adding fields, rescheduling, estimated next week after next."

Day 17 - Second batch of data delivered:
  "Here comes the data."

Day 18 - Business finally starts analyzing,
  but the anomaly has persisted for nearly a month.
After: AskTable Model (5 Minutes)
Minute 1:
  Business: "What are the return rates by category in East China last month?"
  AskTable: Returns results, automatically annotates anomalies.
  "I noticed the Electronic Accessories category has a return rate of 12.8%,
   much higher than other categories at 3-5%."

Minute 2:
  Business: "Which SKUs in Electronic Accessories have the highest return rates?"
  AskTable: Returns Top 10 SKU list.

Minute 3:
  Business: "What do these SKUs' suppliers have in common?"
  AskTable: Automatic attribution analysis.
  "7 of these 10 SKUs are from the same Supplier C,
   and all switched logistics providers within the past 30 days."

Minute 4:
  Business: "Compare return rates by logistics provider."
  AskTable: Generates comparison chart.
  "Logistics Provider D has an 18.6% return rate,
   other logistics providers average 4.2%."

Minute 5:
  Business: "Generate an analysis report, I need to send it to the procurement team immediately."
  AskTable: Automatically generates structured report.

Minute 5 - Decision already made:
  "Suspend cooperation with Logistics Provider D, investigate Supplier C's recent batches."
| Dimension | Traditional Model | AskTable Model |
|---|---|---|
| First response time | 1-2 weeks | 10 seconds |
| Complete analysis cycle | 2-4 weeks | 5 minutes |
| Tech involvement required | Every time | Only for base table setup once |
| Exploratory analysis | Not supported (cost too high) | Anytime |
| Rework rate | 30%+ | Near 0 (business self-queries and self-validates) |
| Monthly data demand processing | 50-100 (manpower bottleneck) | No limit |
| Frontline decision delay | 2-4 weeks | 5 minutes |
| Resources occupied by leadership | Severe | Relieved (everyone queries their own) |
Don't roll out company-wide from the start. Choose one:
Typical entry points: Operations monitoring, sales analysis, supply chain anomaly investigation.
Communicate with tech to have them identify core data needed for this scenario:
Base table design principle: Better more dimensions than fewer. Once base tables are built, business can trim dimensions themselves; but if a key field is missing, tech needs to add it again.
Usually completes in 1-2 days.
30-minute business training to teach staff:
When the first scenario runs smoothly, you'll see immediate effects:
Then replicate the same model to other business scenarios.
Reviewing this solution, what deserves the most reflection isn't the technical breakthrough—it's the restructuring of power dynamics.
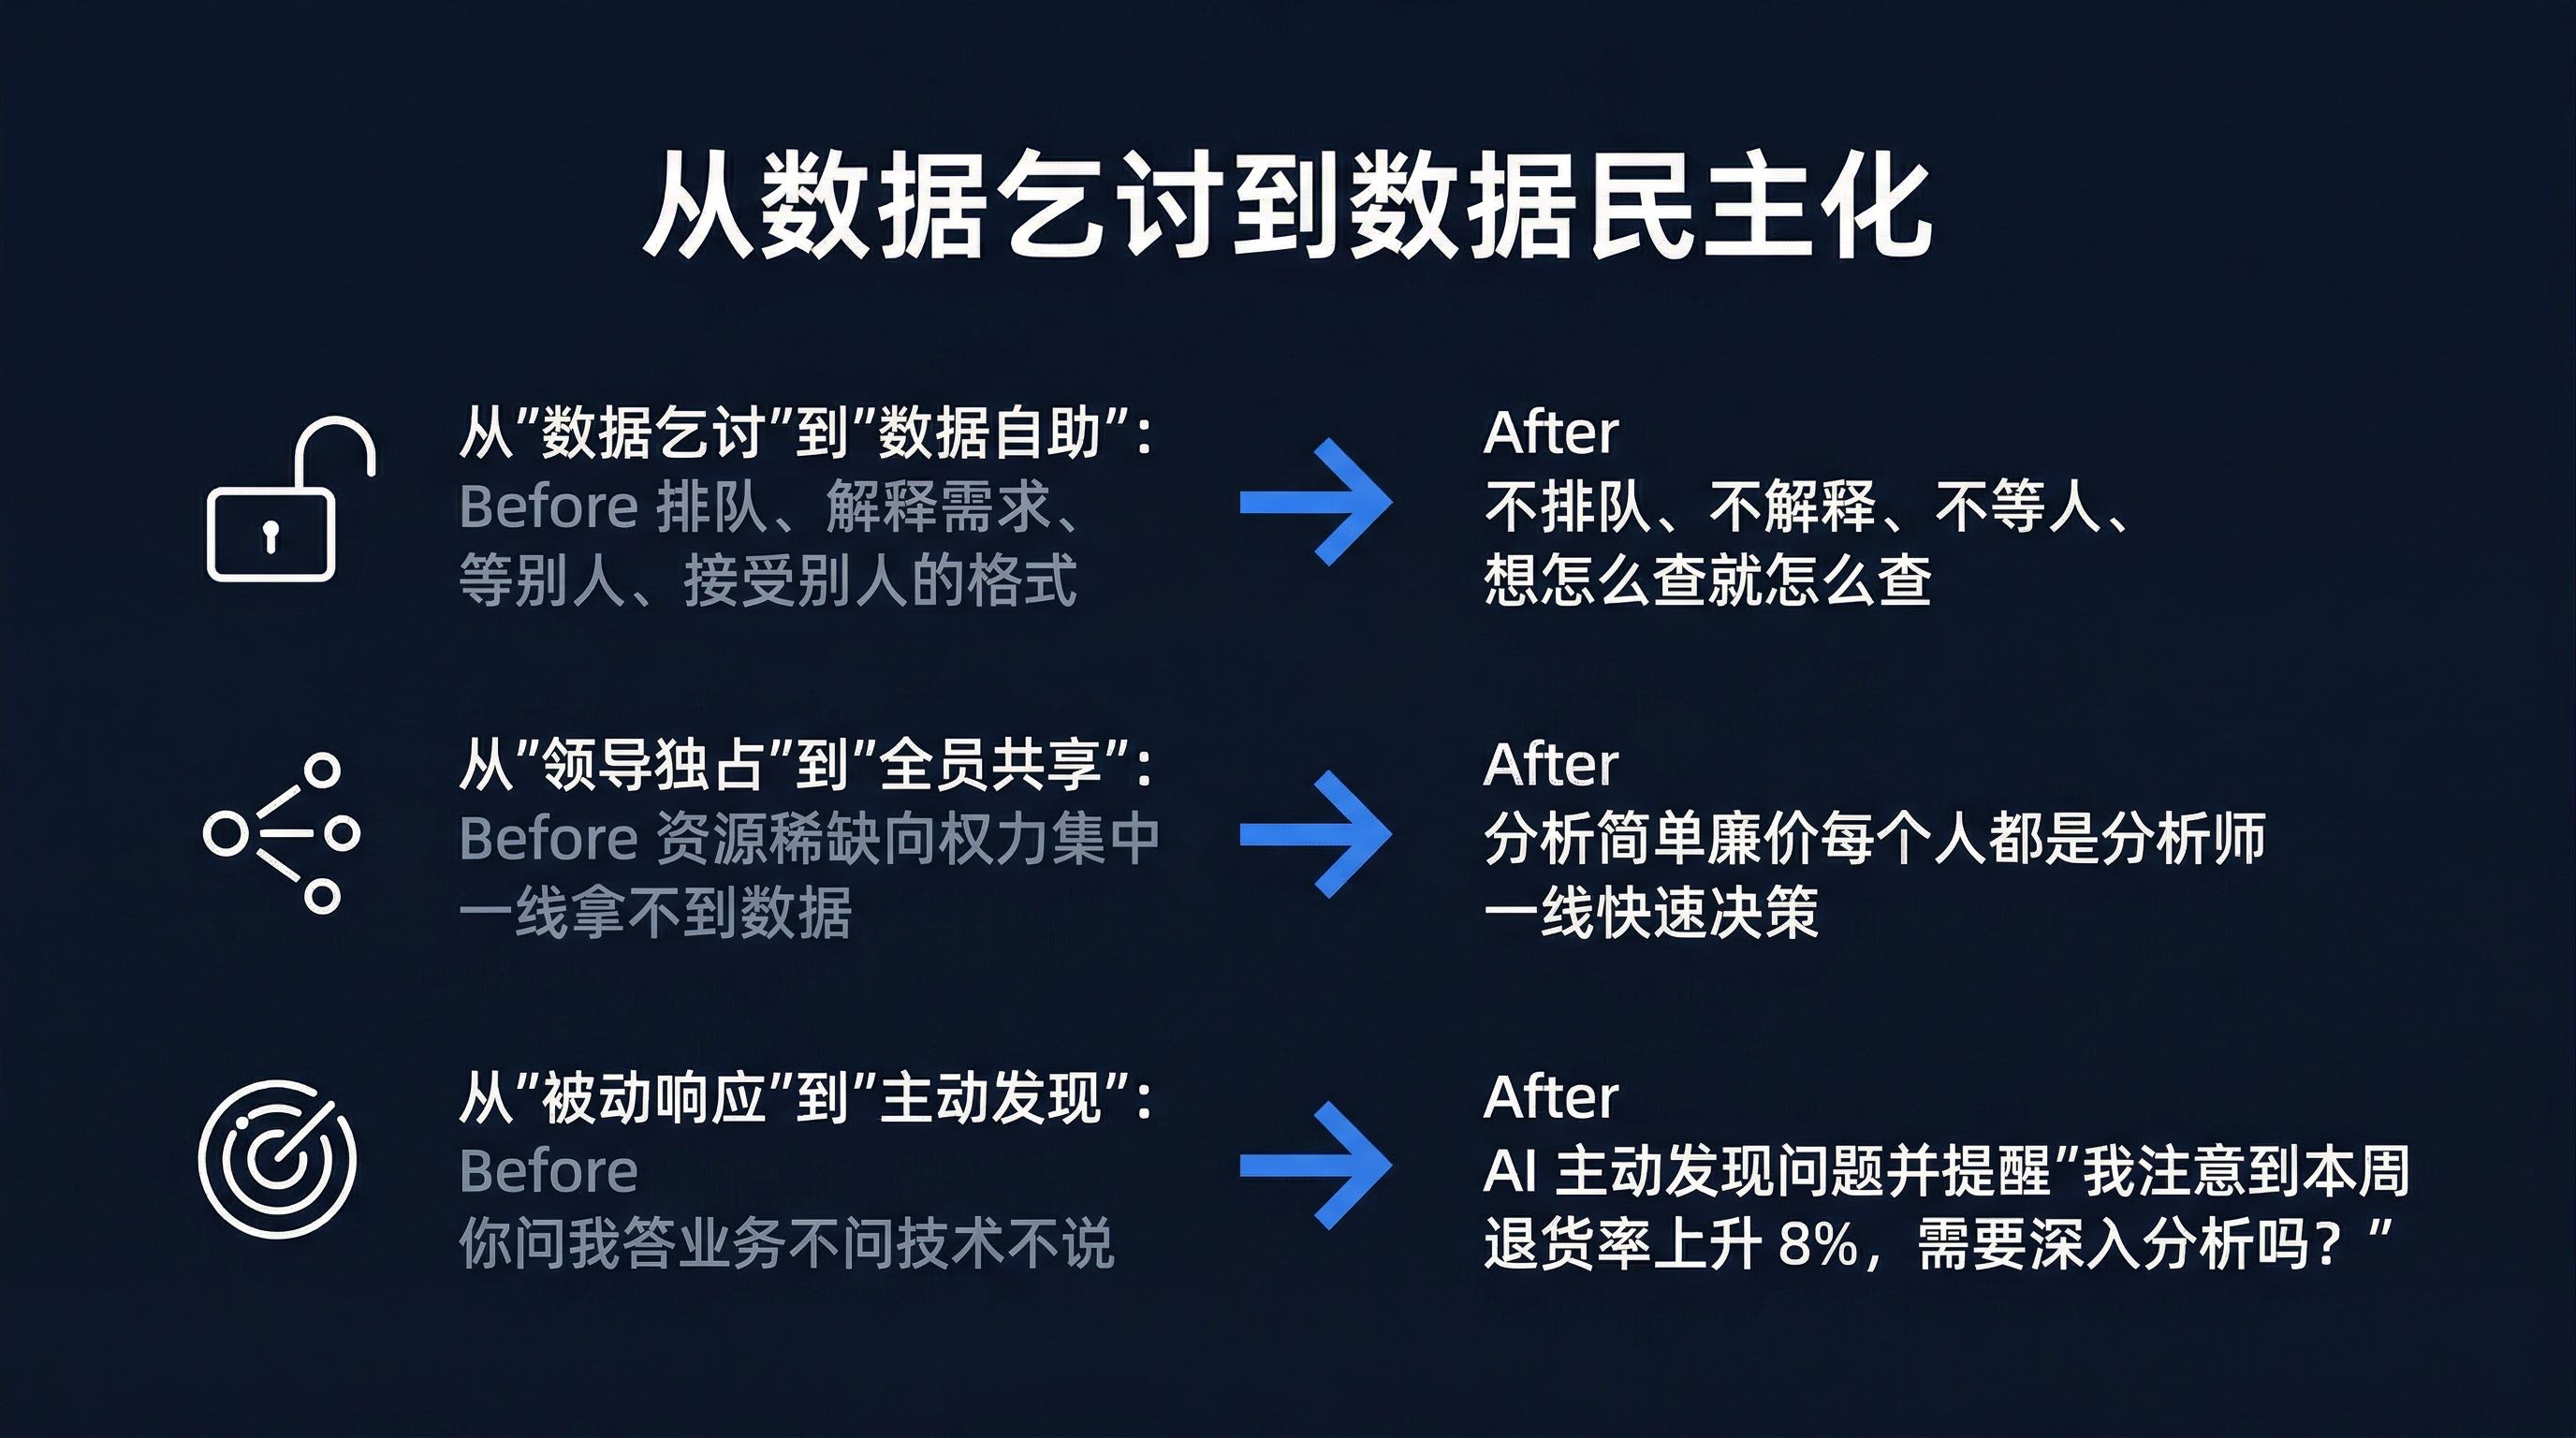
Under the traditional model, business "begs" tech for data—essentially data begging:
Under the AskTable model, business directly accesses data:
This isn't tool upgrade; it's data democratization realized.
Under the traditional model, data analysis resources occupied by leadership is inevitable—because resources are scarce, they naturally concentrate toward power.
When analysis becomes simple and affordable enough, everyone can be their own data analyst. Frontline staff no longer need to wait, no longer need to beg, no longer need to make blind decisions due to lack of data.
Under the traditional model, tech passively responds to business needs—if business doesn't ask, tech doesn't speak.
AskTable's AI Agent proactively discovers problems and alerts business:
"I noticed this week's return rate increased 8 percentage points compared to last week, mainly concentrated in Supplier A's Category B. Need deeper analysis?"
This shift from "you ask, I answer" to "I proactively tell you" is the biggest value of AI data analysis.
The root cause of the "data tug-of-war" between business and tech is essentially an architectural problem.
The core contradiction of traditional architecture: Business's data needs are infinite, changing, exploratory, while tech's supply capacity is limited, fixed, and passively responsive.
AskTable untangles this with an extremely simple approach:
The core logic of this approach aligns with what we discussed in The Third Path for Enterprise AI Implementation—the "capability orchestration" approach: Don't spend energy reinventing wheels, use mature capability combinations to solve business problems.
When your competitors are still queuing two weeks for data requests, your business team has completed data querying, deep analysis, and decision-making in 5 minutes.
This is probably the future of data analysis—not more reports, but less waiting.
Core Perspective: Getting data shouldn't be like begging, making reports shouldn't be like Spring Festival travel. The solution isn't adding people, but changing architecture—tech builds base tables, business self-serves, letting everyone get data within their decision radius.
sidebar.noProgrammingNeeded
sidebar.startFreeTrial
